Fig. 6.
Download original image
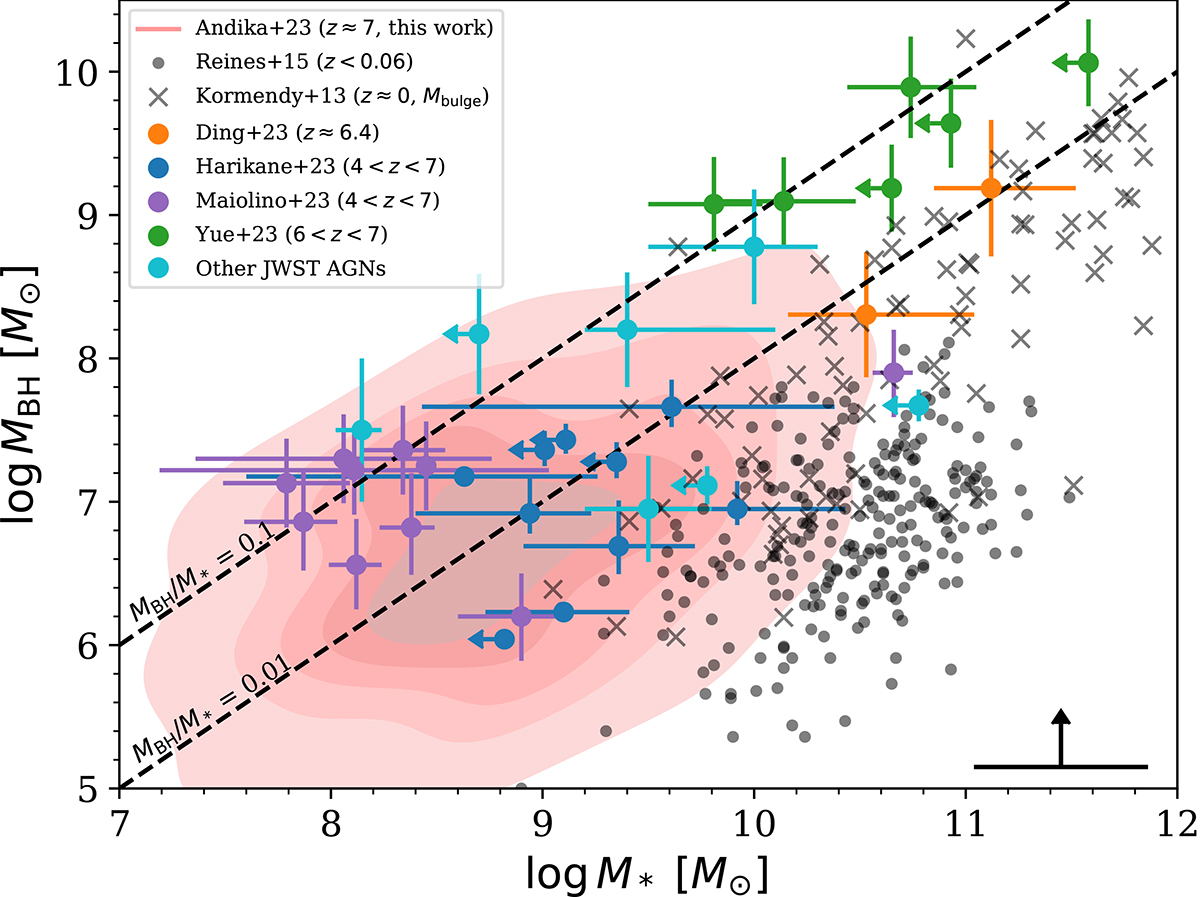
Relation between the black hole mass (MBH) and its host galaxy stellar mass (M*). The red contour represents our quasar candidates at z ≳ 6, where our measurements can only provide lower limits for MBH, considering Eddington ratio values ranging from 0.1 to 1. The typical statistical errors for M* are indicated in the lower right corner of the panel. High-z quasar samples with available JWST spectroscopic data from Harikane et al. (2023), Yue et al. (2023), Ding et al. (2023), and Maiolino et al. (2023, excluding dual AGNs) are presented with blue, green, orange, and purple circles with error bars. Additional AGN samples from Larson et al. (2023a), Übler et al. (2023), Stone et al. (2023), Kocevski et al. (2023), Kokorev et al. (2023), and Goulding et al. (2023) are indicated with cyan circles. The gray dots and crosses are nearby galaxies and AGNs from Kormendy & Ho (2013) and Reines & Volonteri (2015). The black dashed lines mark the limits where MBH/M* equals 0.1 and 0.01. Our candidates show a slightly higher MBH to M* ratios than other galaxies at z ∼ 0 with consistent properties compared to high-z low-luminosity quasars.
Current usage metrics show cumulative count of Article Views (full-text article views including HTML views, PDF and ePub downloads, according to the available data) and Abstracts Views on Vision4Press platform.
Data correspond to usage on the plateform after 2015. The current usage metrics is available 48-96 hours after online publication and is updated daily on week days.
Initial download of the metrics may take a while.