Fig. 5.
Download original image
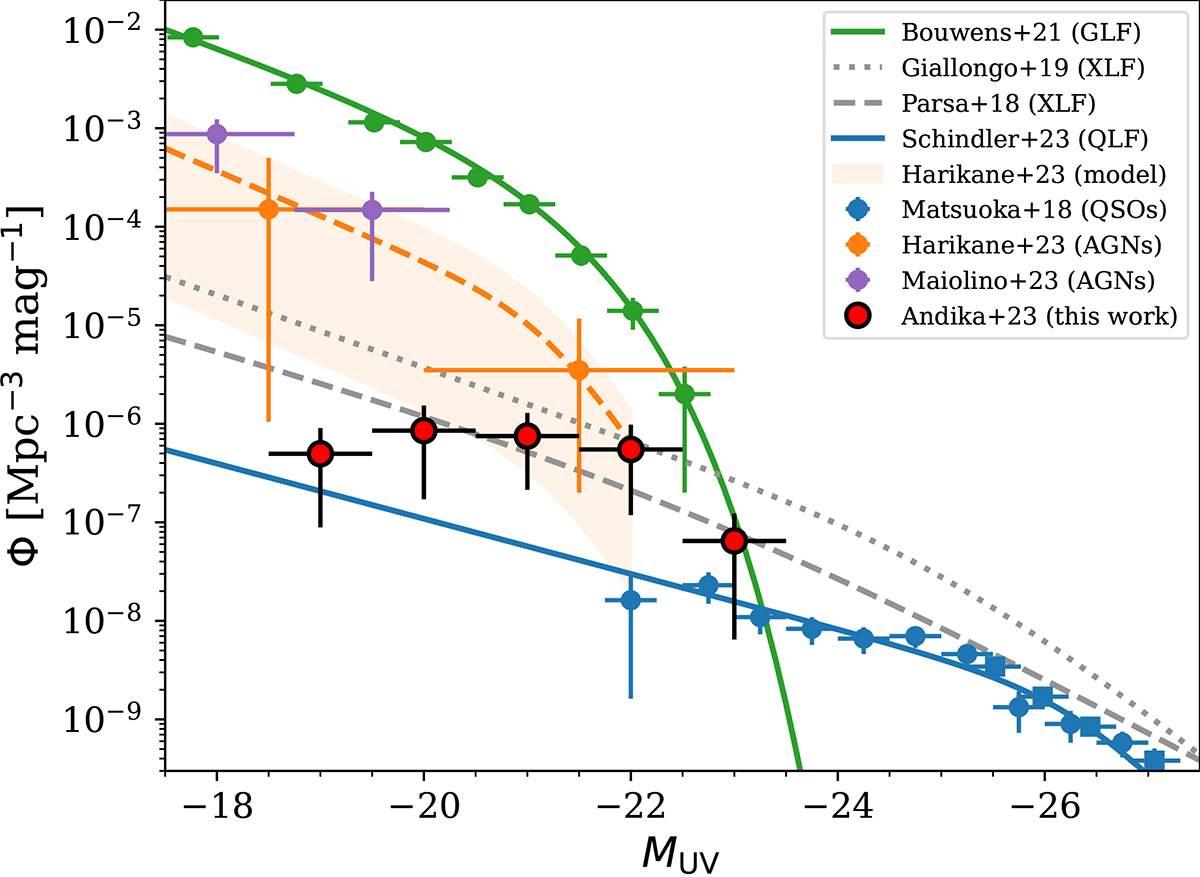
UV luminosity functions of sources at z ∼ 6. The number densities of our quasar candidates as a function of UV absolute magnitude are marked with red circles with error bars. Blue circles and squares represent the data from Matsuoka et al. (2018) and Schindler et al. (2023), where their associated best-fit quasar luminosity function (QLF) is shown with a blue line. The fitted model and observed galaxy luminosity function (GLF) from Bouwens et al. (2021) are displayed with a green line and circles, respectively. A sample of JWST-confirmed AGNs from Harikane et al. (2023) is designated with orange circles, and their double power-law model, along with its uncertainty, is portrayed with an orange dashed line and shaded region. We also show the AGN luminosity function at z = 4–6 reported by Maiolino et al. (2023) with purple circles for comparison. The number density of our quasar candidates is higher than the extrapolation of the bright QLF. Nevertheless, it is consistent with the X-ray selected AGN luminosity function (XLF) from Parsa et al. (2018) and Giallongo et al. (2019), which are denoted as dashed and dotted gray lines.
Current usage metrics show cumulative count of Article Views (full-text article views including HTML views, PDF and ePub downloads, according to the available data) and Abstracts Views on Vision4Press platform.
Data correspond to usage on the plateform after 2015. The current usage metrics is available 48-96 hours after online publication and is updated daily on week days.
Initial download of the metrics may take a while.