Fig. 3.
Download original image
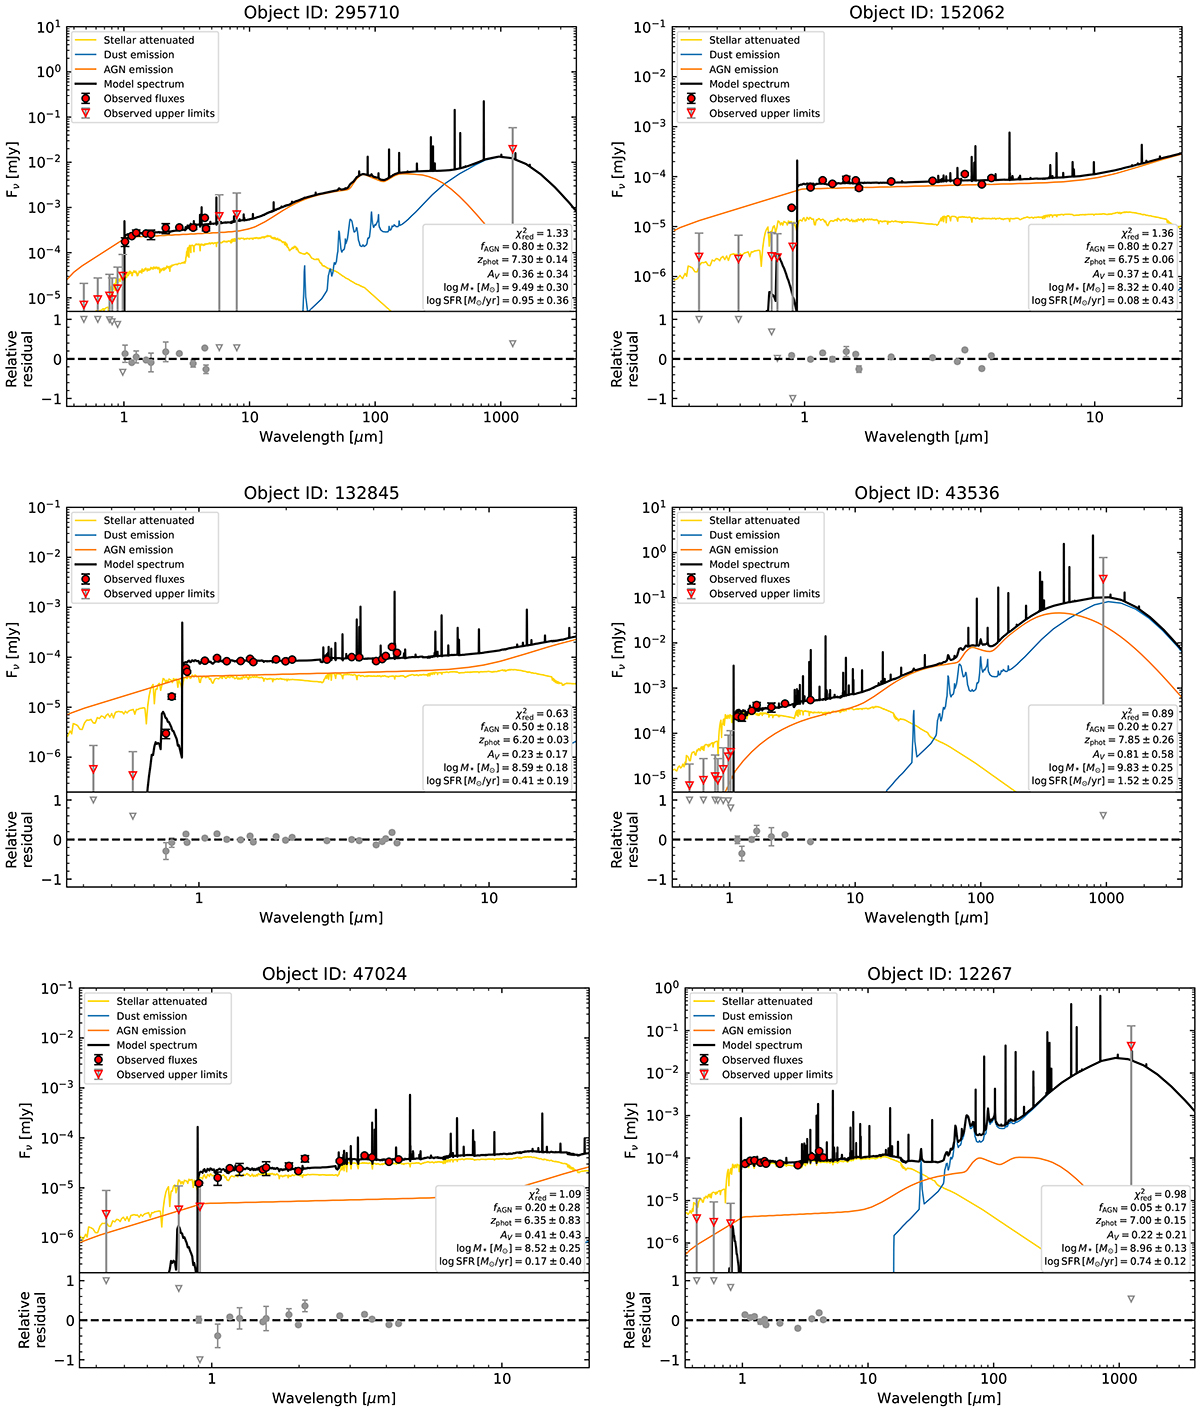
Examples of SED fitting with CIGALE with AGN plus galaxy components. Observed and upper limit fluxes are shown in the upper part of each panel with red dots and triangles with error bars, respectively. The total model spectrum (black) in the observed-frame wavelengths, corrected for the IGM attenuation, is composed of stellar (yellow), dust, and AGN (orange) emissions. These decomposed components are shown without adding the IGM absorption model. We also report the reduced chi-square value (![]() ), fraction of AGN flux to the total emission (fAGN) within rest-wavelengths of 0.1–0.7 μm, photometric redshift (zphot), dust extinction coefficient (AV), host galaxy stellar mass (M*), and star formation rate (SFR). The lower part of each panel displays the relative residual between the data and the model. Sources that are better modeled with no AGN contribution have fAGN ≤ 0.05, while the ones selected as quasar candidates exhibit fAGN ≥ 0.2.
), fraction of AGN flux to the total emission (fAGN) within rest-wavelengths of 0.1–0.7 μm, photometric redshift (zphot), dust extinction coefficient (AV), host galaxy stellar mass (M*), and star formation rate (SFR). The lower part of each panel displays the relative residual between the data and the model. Sources that are better modeled with no AGN contribution have fAGN ≤ 0.05, while the ones selected as quasar candidates exhibit fAGN ≥ 0.2.
Current usage metrics show cumulative count of Article Views (full-text article views including HTML views, PDF and ePub downloads, according to the available data) and Abstracts Views on Vision4Press platform.
Data correspond to usage on the plateform after 2015. The current usage metrics is available 48-96 hours after online publication and is updated daily on week days.
Initial download of the metrics may take a while.