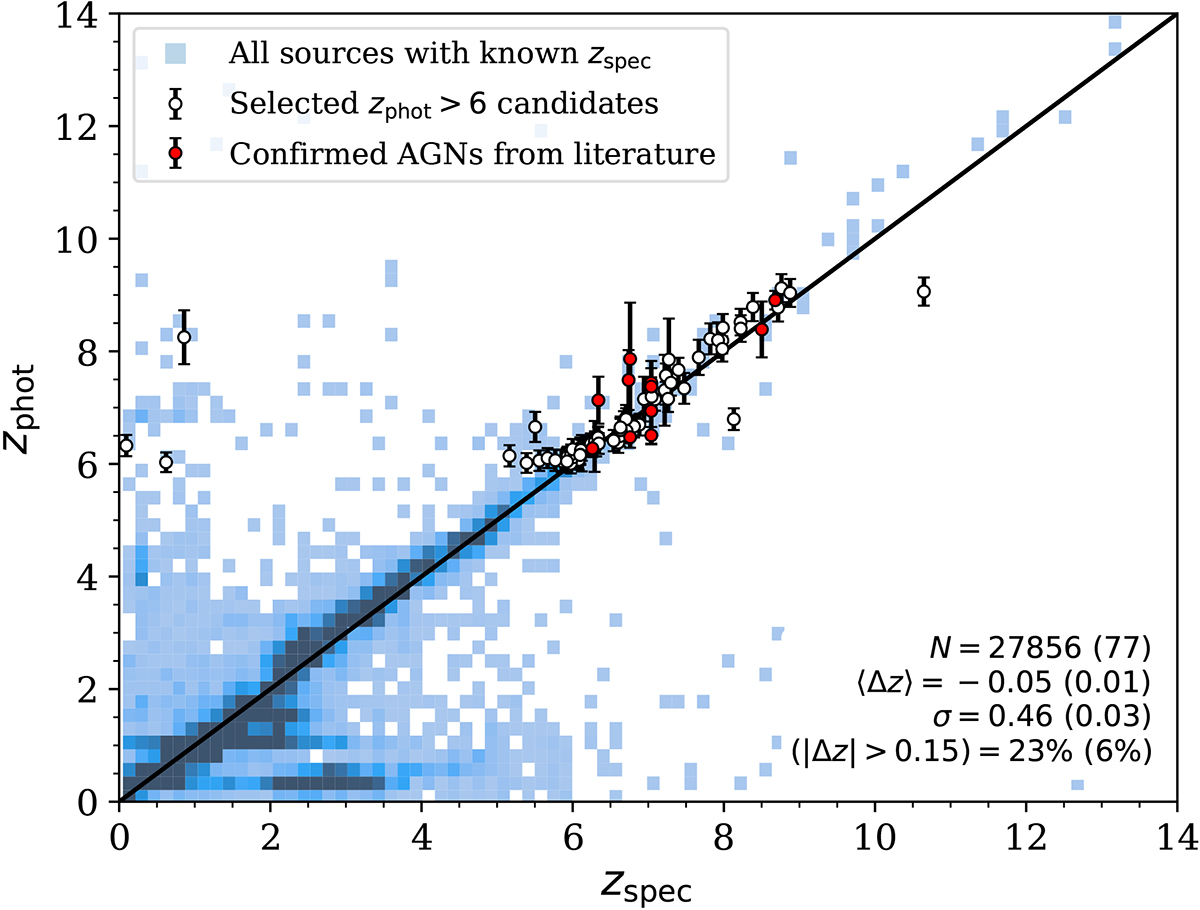
Fig. 2.
Download original image
Comparison between zphot and zspec. The number count (N), average bias (|Δz|), scatter (σ), and outlier fraction (|Δz|> 0.15) of all sources (blue squares) with available spectroscopic data are reported. The region with darker colors corresponds to a higher number of sources within the 2D histogram bins. We also show the metrics for a subset that satisfies our high-z selection criteria (white circles with error bars). Samples of spectroscopically confirmed AGNs from the literature are depicted with red circles.
Current usage metrics show cumulative count of Article Views (full-text article views including HTML views, PDF and ePub downloads, according to the available data) and Abstracts Views on Vision4Press platform.
Data correspond to usage on the plateform after 2015. The current usage metrics is available 48-96 hours after online publication and is updated daily on week days.
Initial download of the metrics may take a while.