Fig. 1.
Download original image
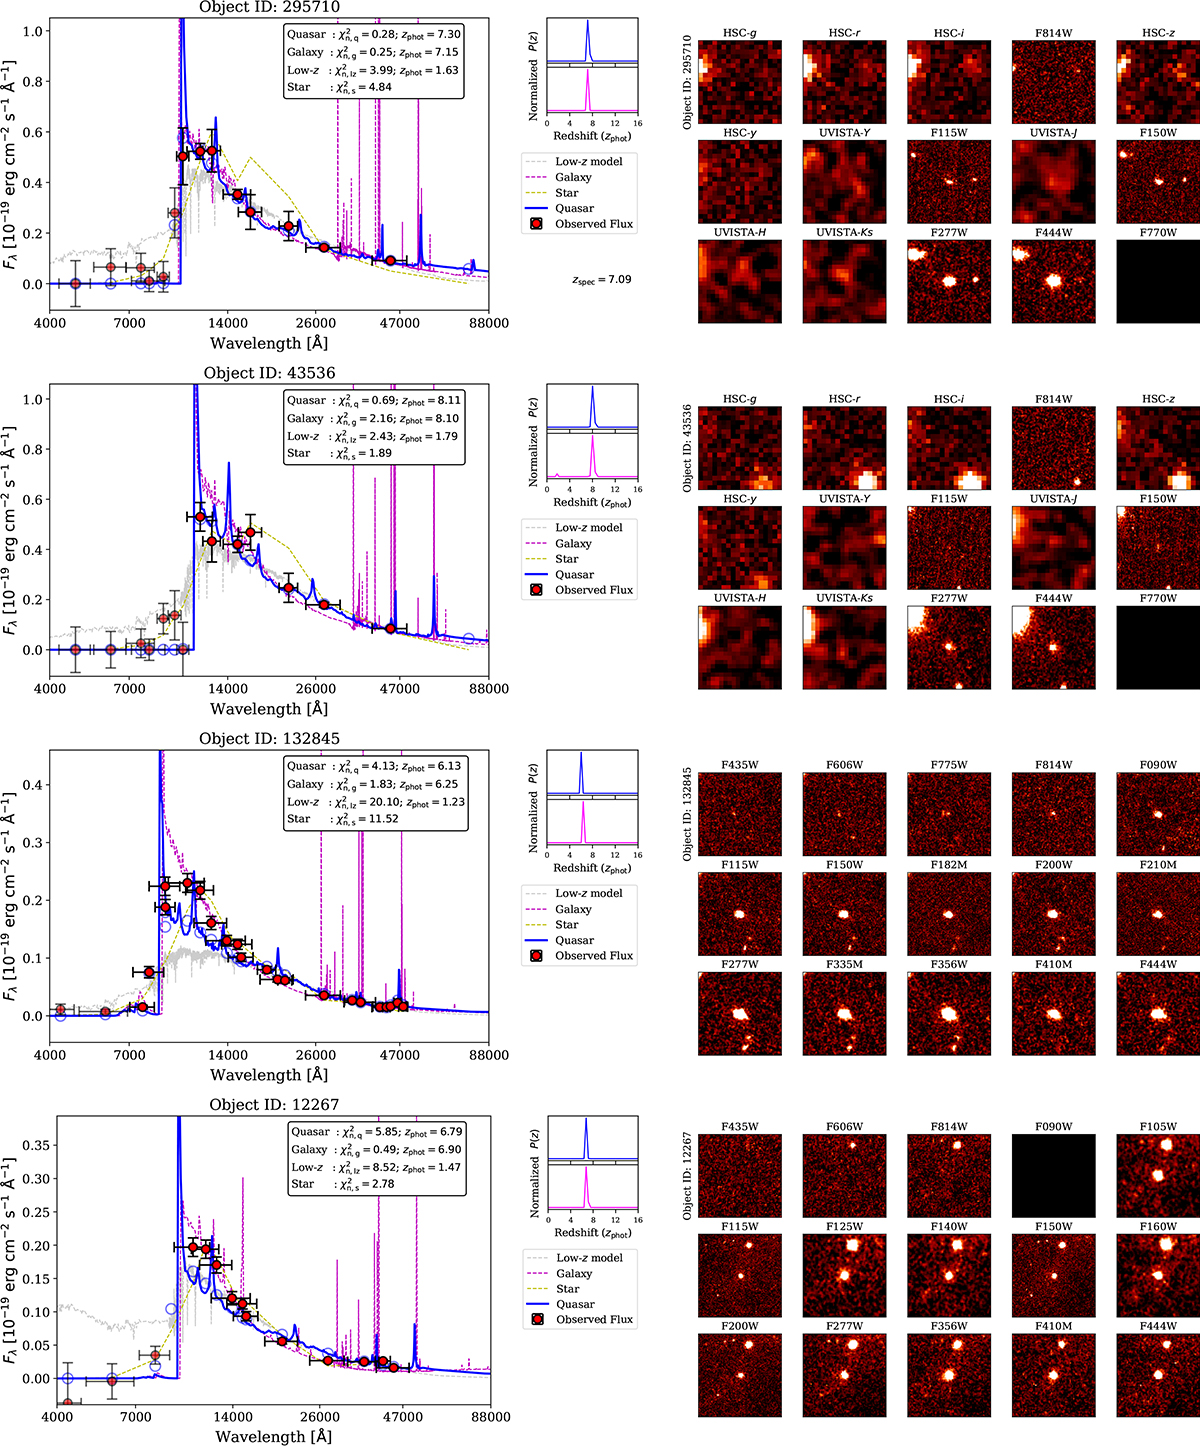
Photometric SEDs of some quasar candidates. In the left part of each panel, we model the observed photometric data points with four types of spectral templates. Fluxes with S/N > 3 are marked with red circles, while those with lower values are shown with a bit transparent color. The best-fit quasar template and its associated synthetic photometry are presented with blue lines and circles. Models based on the galaxy and star/brown dwarf spectra are shown with magenta and yellow lines, with an additional fitted model of low-z sources displayed in gray color. The goodness-of-fit of each model and the estimated redshift are also reported (see main text for a detailed definition). We further indicate the calculated redshift probability distribution function, P(z) for quasar and galaxy models. Finally, the right part of each panel shows the multiband images of the z ≳ 6 quasar candidate, each trimmed to 6″ size on a side.
Current usage metrics show cumulative count of Article Views (full-text article views including HTML views, PDF and ePub downloads, according to the available data) and Abstracts Views on Vision4Press platform.
Data correspond to usage on the plateform after 2015. The current usage metrics is available 48-96 hours after online publication and is updated daily on week days.
Initial download of the metrics may take a while.