Fig. 6.
Download original image
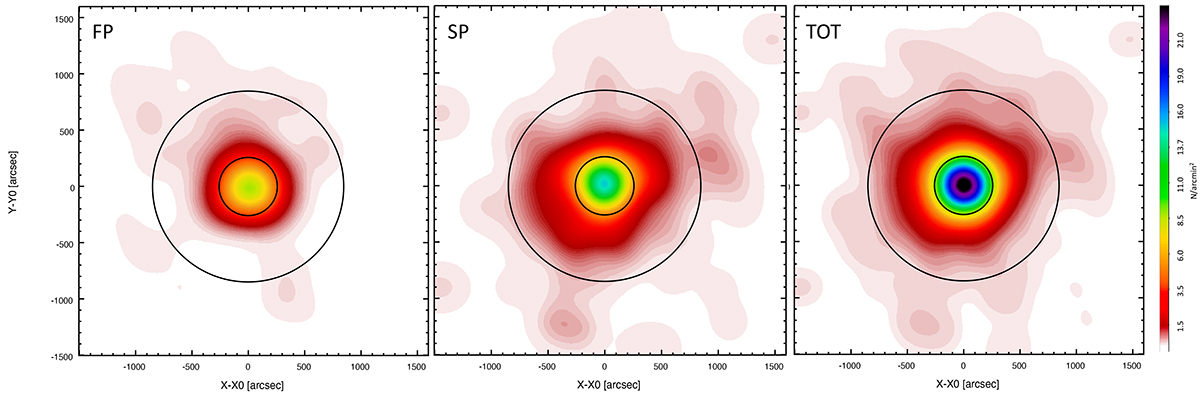
Color-coded surface density map of the analyzed field of view centered on the position of NGC 3201. The left panel shows the 2D map of the FP, the central panel that of SP stars and right panel the 2D map of total population (i.e., SP+FP). The inner and outer circles in each panel have a radius of 250″ and 800″, respectively. North is up, east is right.
Current usage metrics show cumulative count of Article Views (full-text article views including HTML views, PDF and ePub downloads, according to the available data) and Abstracts Views on Vision4Press platform.
Data correspond to usage on the plateform after 2015. The current usage metrics is available 48-96 hours after online publication and is updated daily on week days.
Initial download of the metrics may take a while.