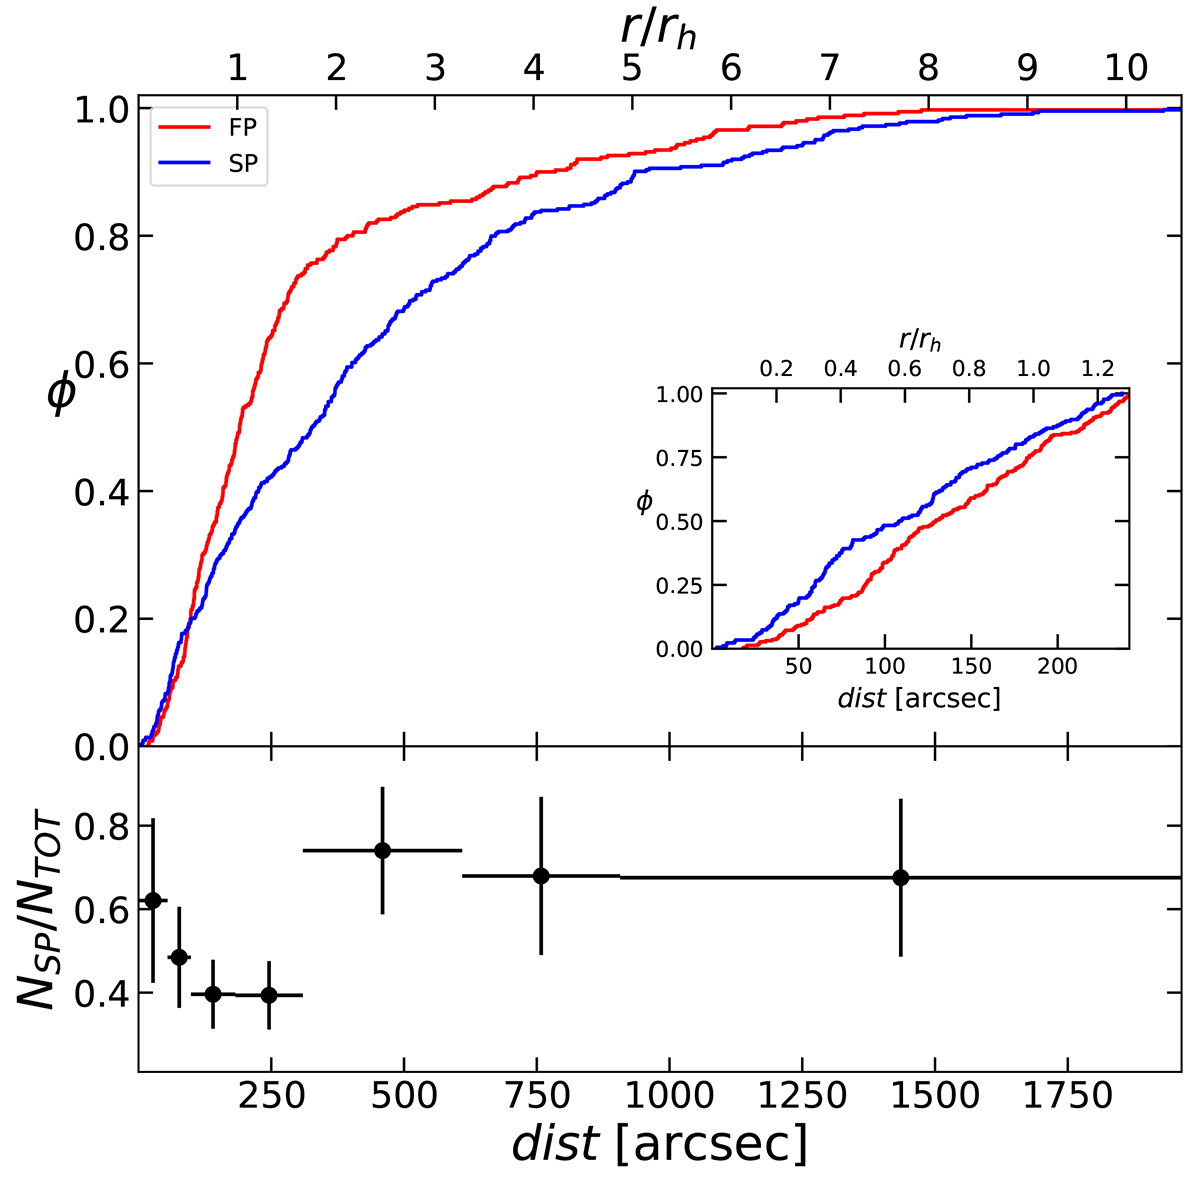
Fig. 5.
Download original image
Cumulative radial distribution and number ratio of MPs. Top panel: cumulative radial distribution of the FP (red curve) and SP (blue curve). The inset panel shows the cumulative distribution of stars within the cluster half-mass radius. Bottom panel: ratio between the number of SP stars NSP and the total amount of stars NTOT = NFP + NSP calculated in different radial bins.
Current usage metrics show cumulative count of Article Views (full-text article views including HTML views, PDF and ePub downloads, according to the available data) and Abstracts Views on Vision4Press platform.
Data correspond to usage on the plateform after 2015. The current usage metrics is available 48-96 hours after online publication and is updated daily on week days.
Initial download of the metrics may take a while.