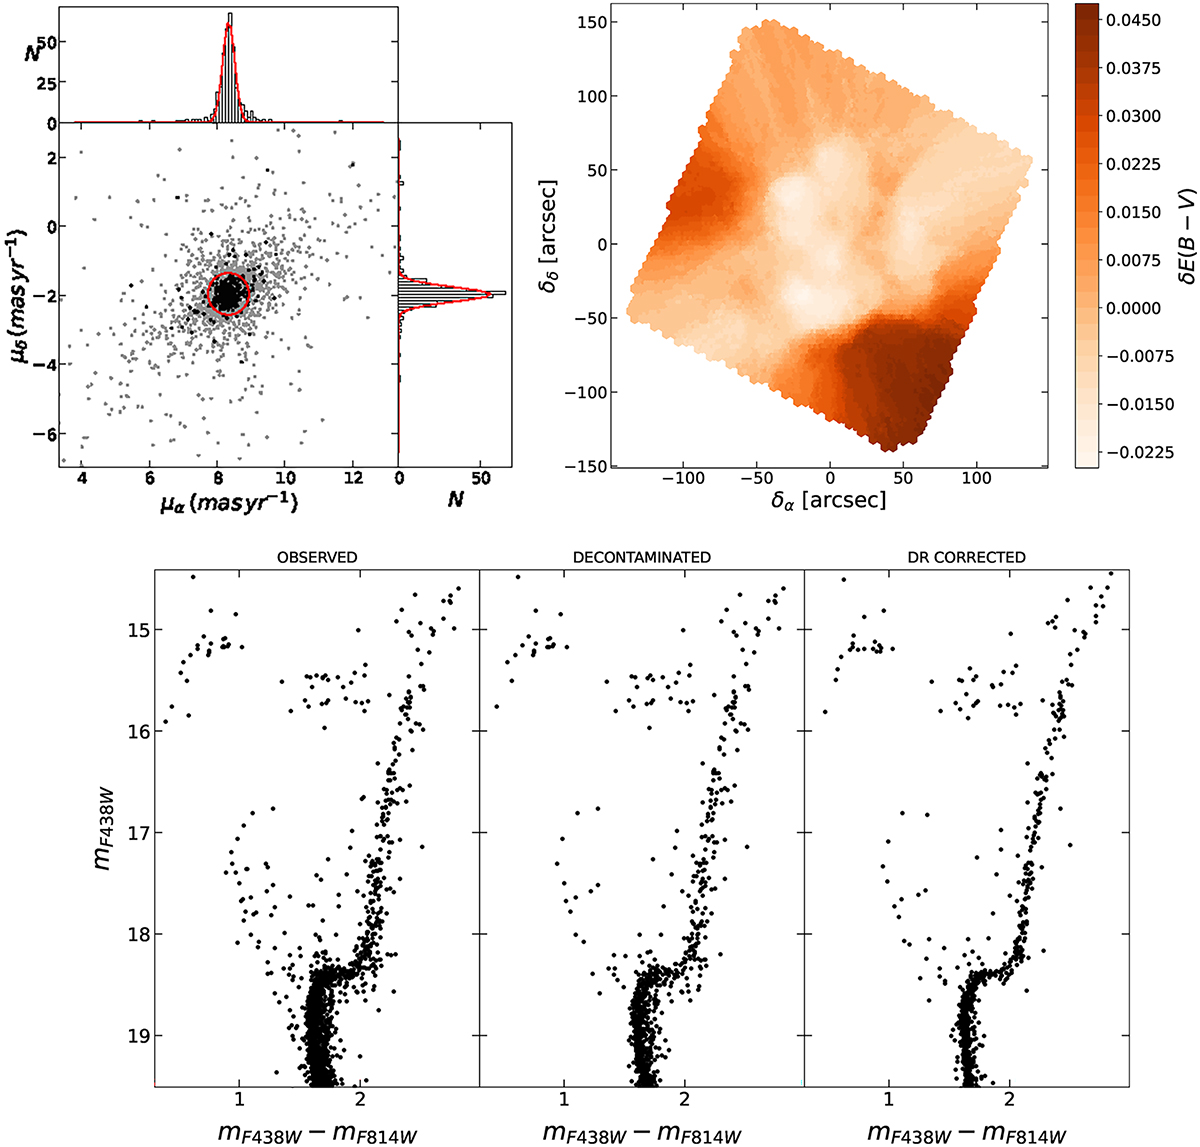
Fig. 1.
Download original image
Field decontamination and differential reddening correction of the HST dataset. Top left-hand panel: vector point diagram of the cluster stars (gray dots) as measured by Gaia DR3. RGB stars are highlighted as black dots. The upper and side panels show the histogram of the proper motions along the two axis and the best-fit Gaussian function (red curve). The red circle has a radius equal to 2σ the combined standard deviations of the two best-fit Gaussian functions. All the stars within the circle are selected as bona-fide cluster stars. Top right-hand panel: differential reddening map of NGC 3201 within the HST field of view. The color-bar on the right codifies the amount of the relative differential reddening. The coordinates along the x- and y-axes are reported with respect to the cluster center. Bottom panels: (mF438W − mF814W, mF438W) CMD of NGC 3201 including all the stars of the HST dataset, shown on the left. The middle and right-hand panels show the CMD following the decontamination from field interlopers and the differential reddening correction, respectively.
Current usage metrics show cumulative count of Article Views (full-text article views including HTML views, PDF and ePub downloads, according to the available data) and Abstracts Views on Vision4Press platform.
Data correspond to usage on the plateform after 2015. The current usage metrics is available 48-96 hours after online publication and is updated daily on week days.
Initial download of the metrics may take a while.