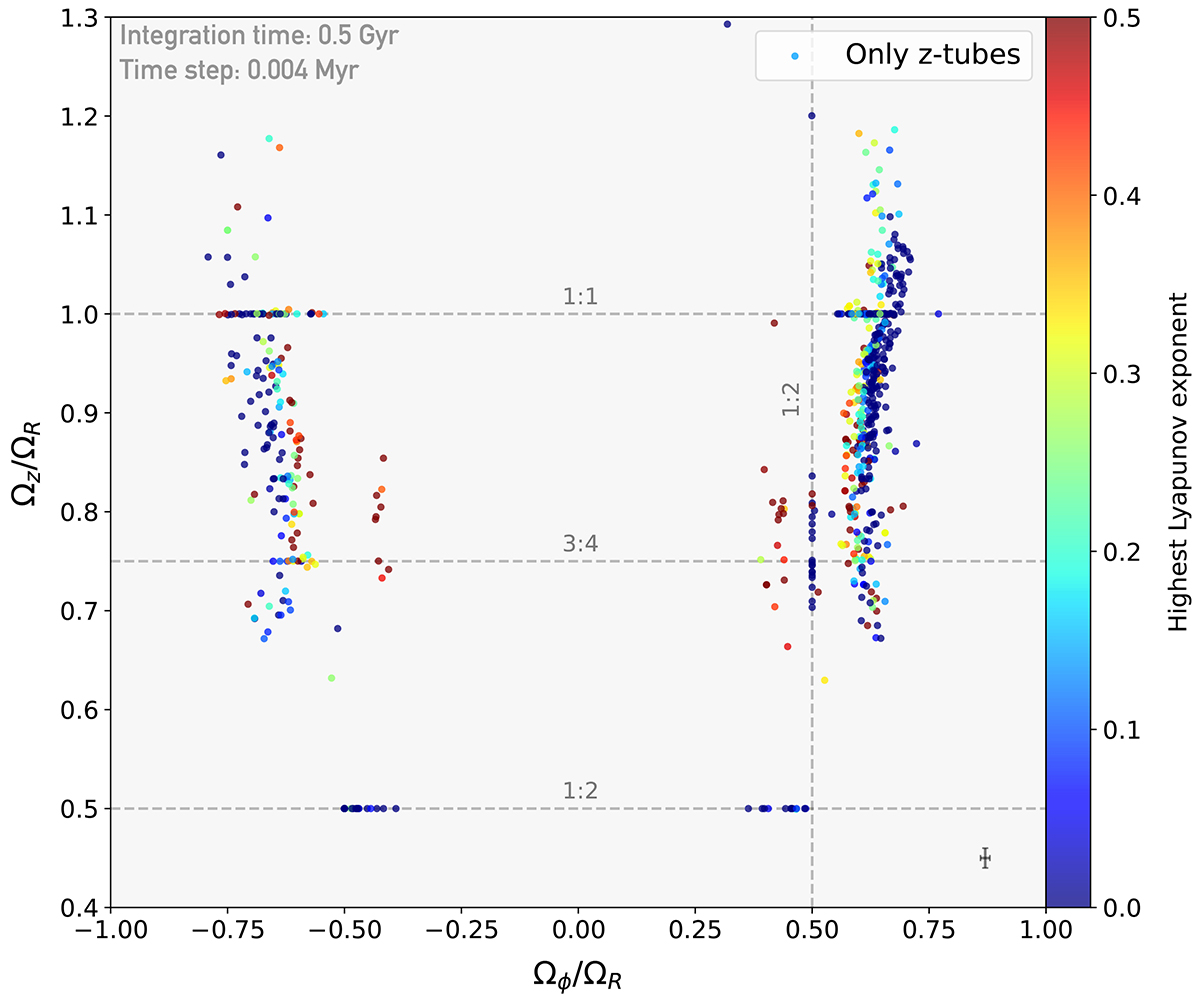
Fig. 9.
Download original image
Frequency map in cylindrical coordinates for z-tubes alone (orbits for which a circulation around the z-axis has been detected), i.e. orbits from the resonance (1:−1:0) in Cartesian coordinates (see Fig. 8). The horizontal and vertical lines correspond to resonances between Ωz and ΩR and between Ωϕ and ΩR respectively. The typical error on both frequency ratios arising from the propagation of the observational uncertainties and the distance uncertainty is indicated in the lower right corner.
Current usage metrics show cumulative count of Article Views (full-text article views including HTML views, PDF and ePub downloads, according to the available data) and Abstracts Views on Vision4Press platform.
Data correspond to usage on the plateform after 2015. The current usage metrics is available 48-96 hours after online publication and is updated daily on week days.
Initial download of the metrics may take a while.