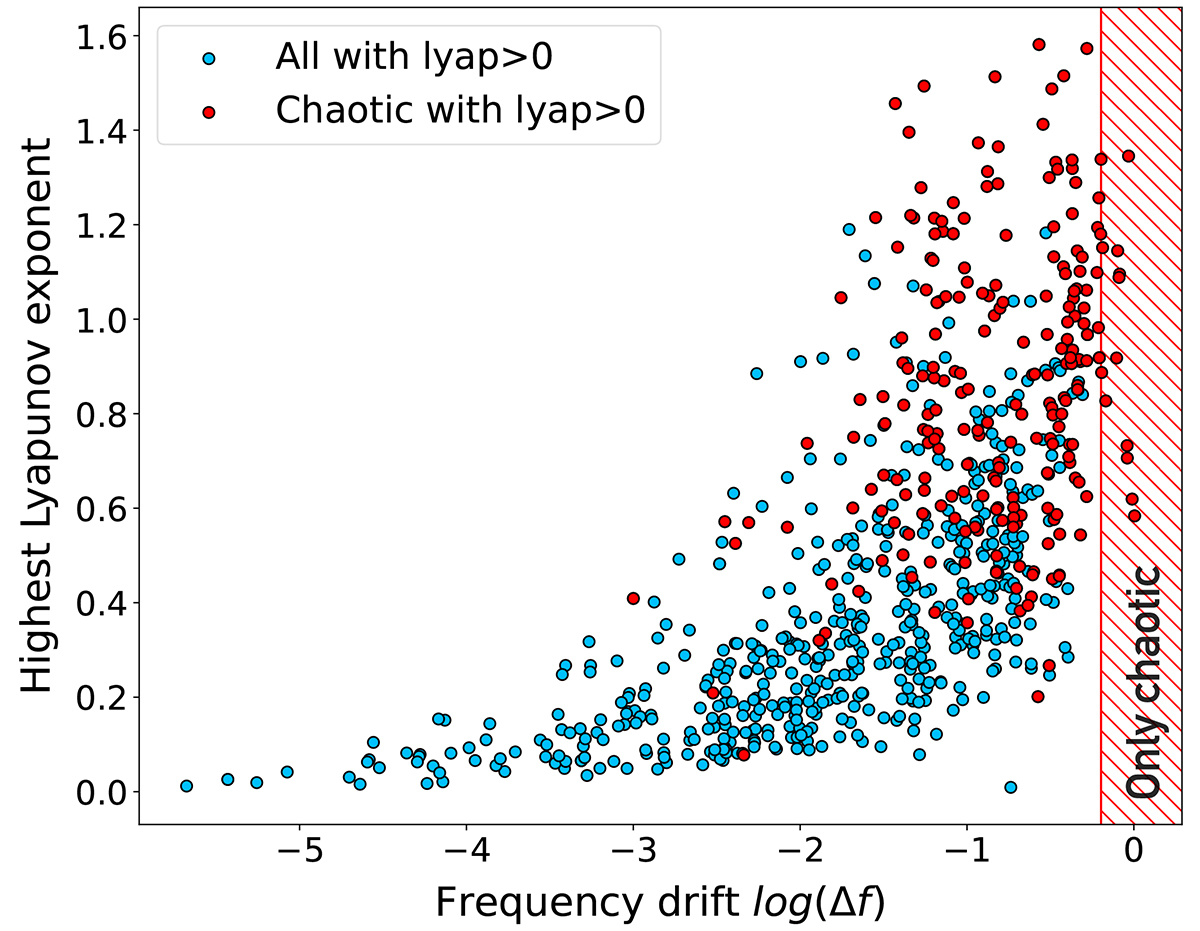
Fig. 4.
Download original image
Comparison between highest Lyapunov exponent and frequency drift. The red points show the chaotic orbits identified with the visual classification (see Sect. 4.2.2) while the red shaded area indicates the zone containing only chaotic orbits according to the frequency drift method (see Sect. 3.3.2). Only orbits with a highest Lyapunov exponent greater than 0 are shown in this diagram.
Current usage metrics show cumulative count of Article Views (full-text article views including HTML views, PDF and ePub downloads, according to the available data) and Abstracts Views on Vision4Press platform.
Data correspond to usage on the plateform after 2015. The current usage metrics is available 48-96 hours after online publication and is updated daily on week days.
Initial download of the metrics may take a while.