Open Access
Fig. B.3.
Download original image
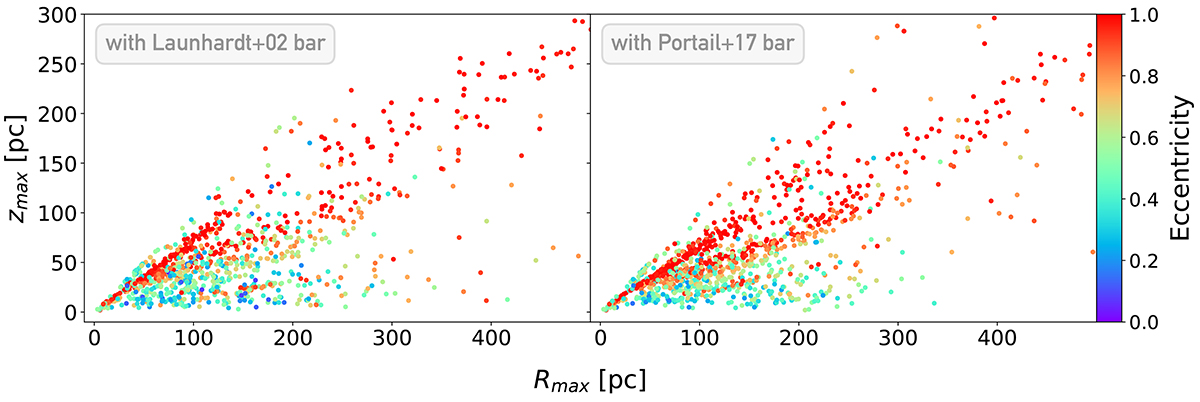
Rmax vs. zmax diagram comparison with different bar potentials. Left: Reference diagram, with the bar potential from Launhardt et al. (2002). Right: Using the bar potential from Portail et al. (2017). In both cases, the NSD and NSC potentials are not changed.
Current usage metrics show cumulative count of Article Views (full-text article views including HTML views, PDF and ePub downloads, according to the available data) and Abstracts Views on Vision4Press platform.
Data correspond to usage on the plateform after 2015. The current usage metrics is available 48-96 hours after online publication and is updated daily on week days.
Initial download of the metrics may take a while.