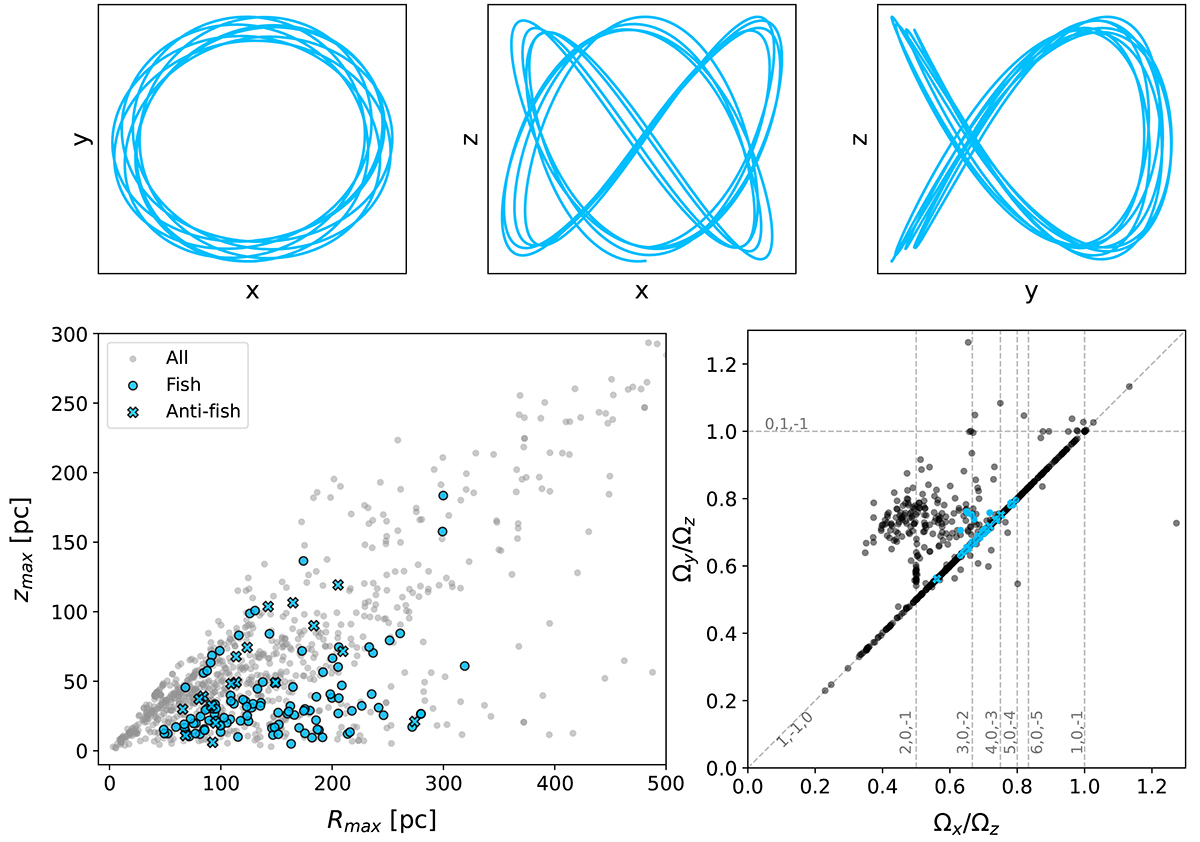
Fig. A.4.
Download original image
Example of a fish orbit (here, a (y, z) fish), i.e. 3 : 2 resonance between two orbital frequencies (here, Ωz and Ωy, also called (0 : 3 : −2)). Upper panel: Orbit plotted in the (x, y), (x, z) and (y, z) planes. Lower panel:Rmax vs. zmax diagram (left) and Cartesian frequency map (right). The coloured markers correspond to the fish and anti-fish orbits identified with the visual method (see 4.2.2).
Current usage metrics show cumulative count of Article Views (full-text article views including HTML views, PDF and ePub downloads, according to the available data) and Abstracts Views on Vision4Press platform.
Data correspond to usage on the plateform after 2015. The current usage metrics is available 48-96 hours after online publication and is updated daily on week days.
Initial download of the metrics may take a while.