Fig. 10.
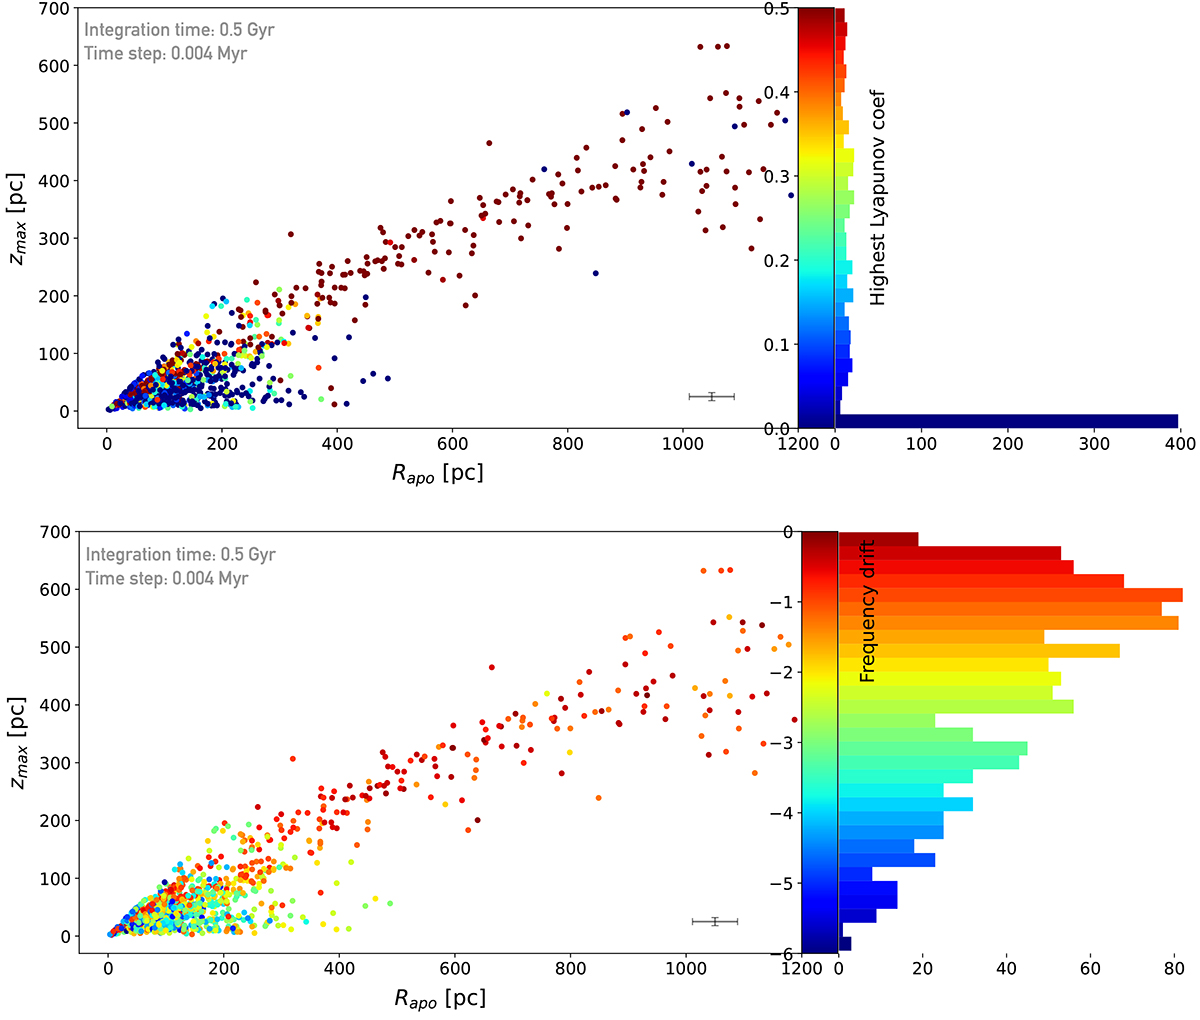
Download original image
Upper panel: Rmax vs. zmax vs. Lyapunov. Lower panel: Rmax vs. zmax vs. frequency drift. Red indicates the most chaotic orbits in both methods. The typical error on both parameters arising from the propagation of the observational uncertainties and the distance uncertainty is indicated in the lower right corner of each plot.
Current usage metrics show cumulative count of Article Views (full-text article views including HTML views, PDF and ePub downloads, according to the available data) and Abstracts Views on Vision4Press platform.
Data correspond to usage on the plateform after 2015. The current usage metrics is available 48-96 hours after online publication and is updated daily on week days.
Initial download of the metrics may take a while.