Open Access
Fig. 1.
Download original image
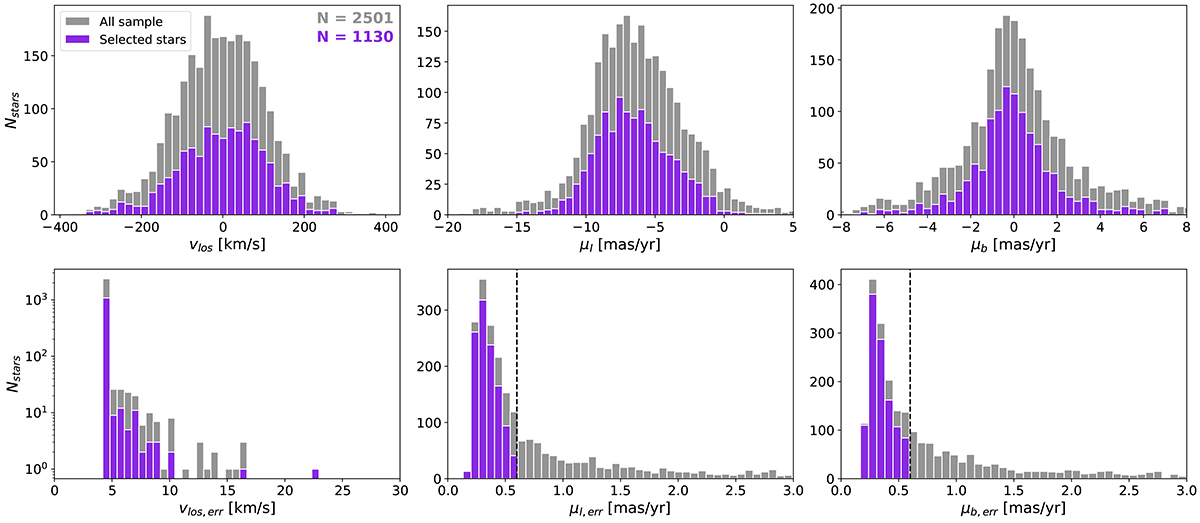
Upper panel: histograms of the radial velocities and proper motions in μl and μb, respectively. Lower panel: same, but for the uncertainties. The grey sample is the full sample, and our final sample, used for the analysis, is shown in magenta.
Current usage metrics show cumulative count of Article Views (full-text article views including HTML views, PDF and ePub downloads, according to the available data) and Abstracts Views on Vision4Press platform.
Data correspond to usage on the plateform after 2015. The current usage metrics is available 48-96 hours after online publication and is updated daily on week days.
Initial download of the metrics may take a while.