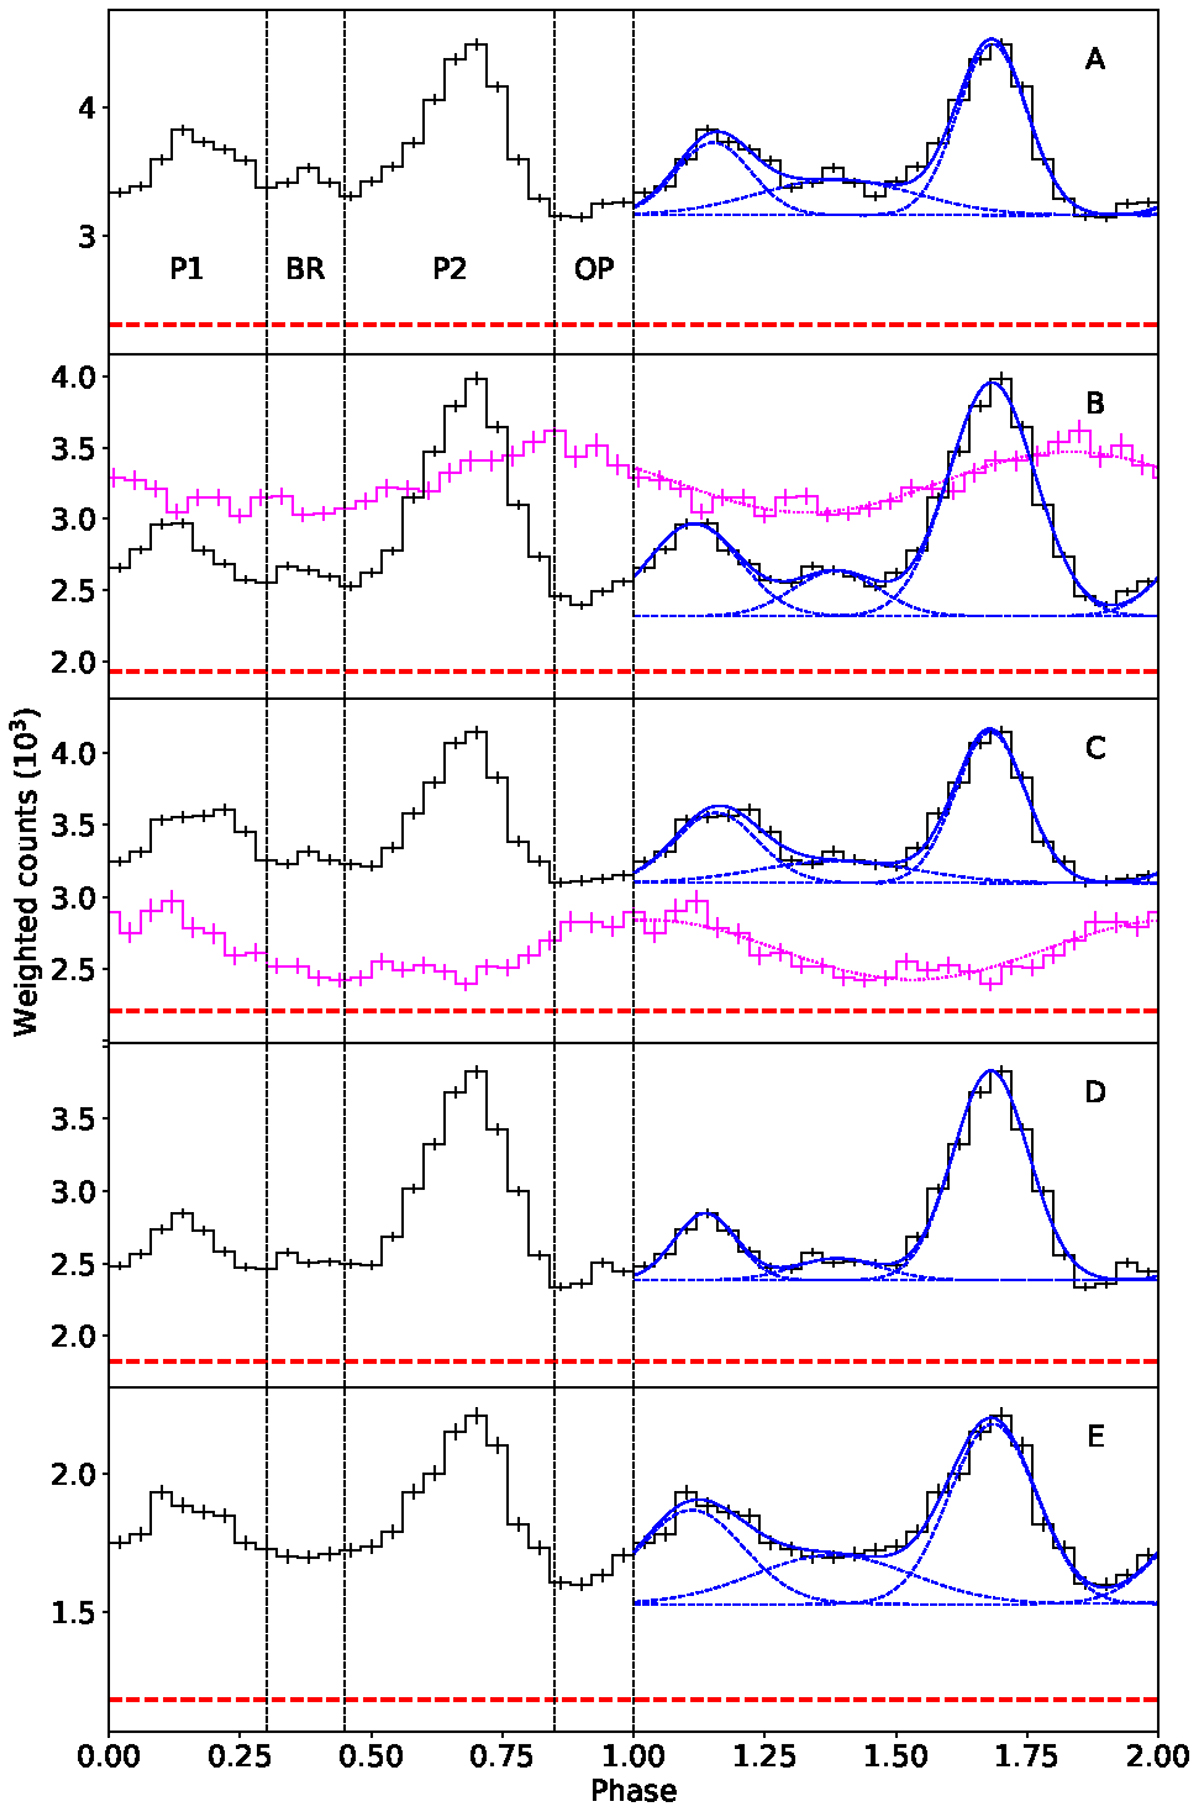
Fig. 3.
Download original image
Pulse profile of PSR J2021+4026 in different time intervals. Black solid lines represent the weighted histograms of γ-ray counts produced with phase bins of size 0.04. Only statistical uncertainties are reported. Blue solid lines show the γ-ray best-fit functions. Blue dashed lines represent single Gaussian components. The γ-ray background is estimated from the photon probabilities and is reported with red dashed lines. Vertical dashed lines represent the boundaries of the phase intervals defined in Sect. 3.5. For the sake of completeness, we include the X-ray histograms (magenta solid lines) and best-fit functions (magenta dotted lines) as reported by Razzano et al. (2023). The scales and offsets of the X-ray curves are arbitrary.
Current usage metrics show cumulative count of Article Views (full-text article views including HTML views, PDF and ePub downloads, according to the available data) and Abstracts Views on Vision4Press platform.
Data correspond to usage on the plateform after 2015. The current usage metrics is available 48-96 hours after online publication and is updated daily on week days.
Initial download of the metrics may take a while.