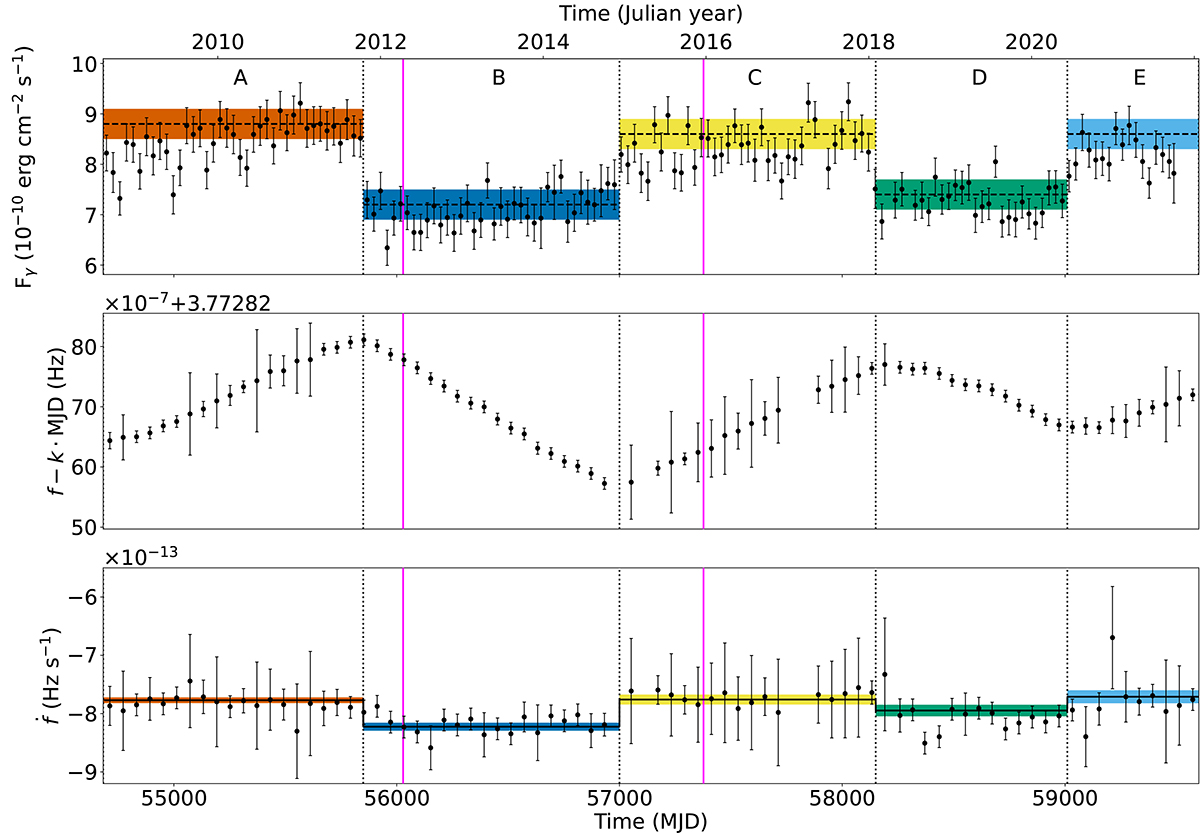
Fig. 1.
Download original image
Energy flux and timing parameters of PSR J2021+4026 in the time range from August 5, 2008, to October 6, 2021. In the top panel, error bars are the result of maximum likelihood fits to 30-day intervals. We show the best-fit values (horizontal dashed lines) and the 3σ confidence bands of the flux reported in Table 1, obtained with the phase-averaged spectral analysis (Sect. 3.3) in the time intervals A (red), B (blue), C (yellow), D (green), and E (cyan). Vertical dashed lines indicate the boundaries of these time intervals. In the mid and bottom panels, error bars are obtained with weighted H-tests on 60-day intervals. To enhance the changes in the slope, we report f − k⋅ MJD rather than f, where k = 6.847 × 10⁻⁸ Hz day−1 is an average spin-down rate obtained from a χ2 fit. The solid line and the colored intervals represent the evolution of the spin-down rate predicted using the parameters of Table 2, obtained with the method described in Sect. 3.4. We omitted all points with significance < 5σ. The vertical solid magenta lines at MJD 56028 (April 11, 2012) and MJD 57376 (December 20, 2015) indicate the epochs of the XMM-Newton observations analyzed by Razzano et al. (2023).
Current usage metrics show cumulative count of Article Views (full-text article views including HTML views, PDF and ePub downloads, according to the available data) and Abstracts Views on Vision4Press platform.
Data correspond to usage on the plateform after 2015. The current usage metrics is available 48-96 hours after online publication and is updated daily on week days.
Initial download of the metrics may take a while.