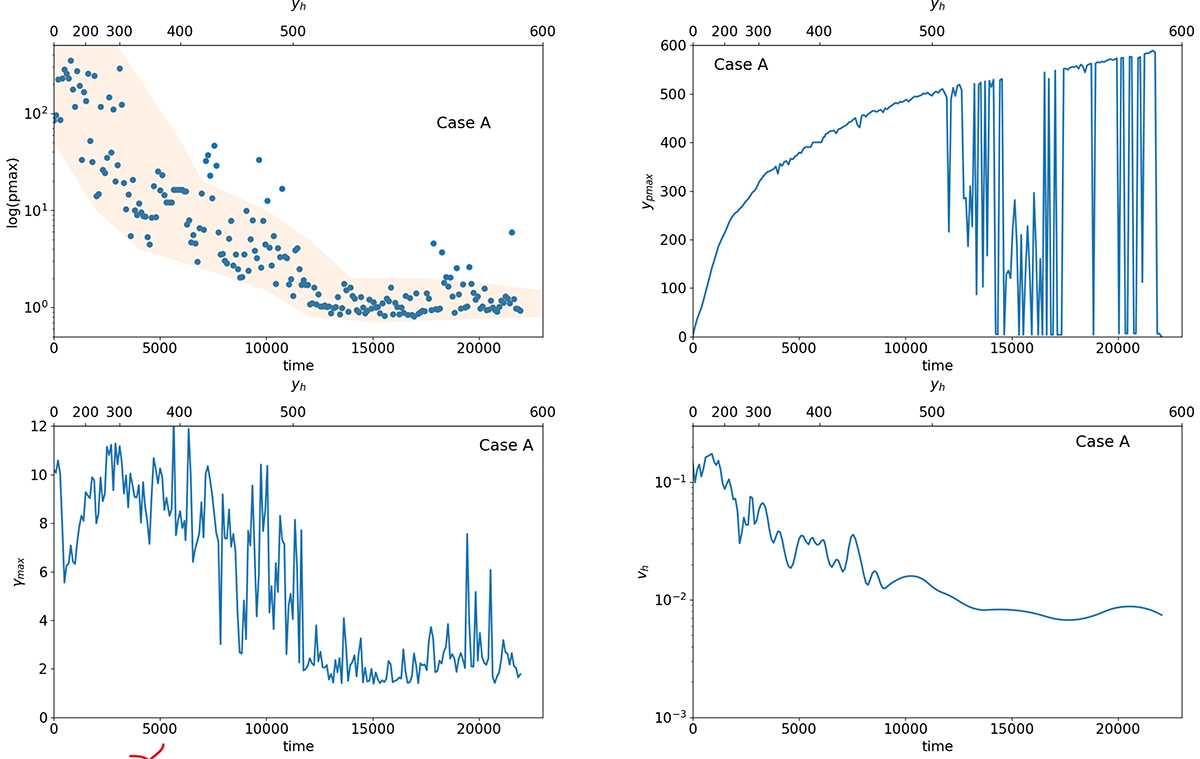
Fig. 6.
Download original image
Four different plots describing different aspects of the jet dynamical behavior for Case A. Top left panel: maximum pressure found in the computational domain as a function of time (bottom axis) and the position reached by the jet head (top axis). The symbols mark the values for each time, while the colored band identifies the range of variation. Top right panel: plot of y coordinate of maximum pressure, plotted in the top left panel, as a function of time (bottom axis) and the position reached by the jet head (top axis). Bottom left panel: plot of maximum Lorentz factor near the jet head as a function of time (bottom axis) and position reached by the jet head (top axis). More precisely, the maximum value of γ is in the region yh − 50 < y < yh, where yh is the jet-head position. Bottom right panel: plot of jet-head velocity as a function of time (bottom axis) and position reached by the jet head (top axis).
Current usage metrics show cumulative count of Article Views (full-text article views including HTML views, PDF and ePub downloads, according to the available data) and Abstracts Views on Vision4Press platform.
Data correspond to usage on the plateform after 2015. The current usage metrics is available 48-96 hours after online publication and is updated daily on week days.
Initial download of the metrics may take a while.