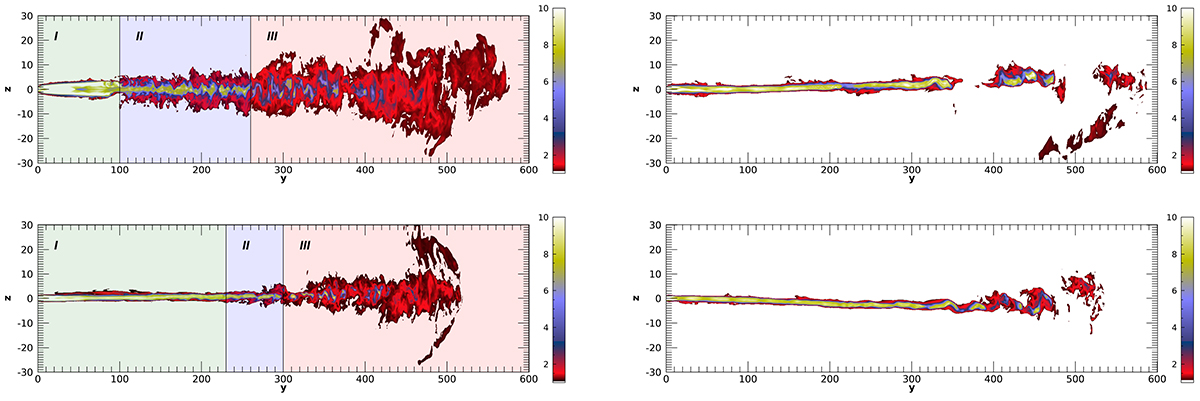
Fig. 3.
Download original image
Longitudinal cut (in the y − z plane) of Lorentz factor distribution at final simulation times. The four panels refer to the four different cases (Case A: top left; Case B: top right; Case C: bottom left; Case D: bottom right). The times are the same as in Fig. 2. The three colored bands in the left panels (Cases A and C) highlight the three phases described in the text.
Current usage metrics show cumulative count of Article Views (full-text article views including HTML views, PDF and ePub downloads, according to the available data) and Abstracts Views on Vision4Press platform.
Data correspond to usage on the plateform after 2015. The current usage metrics is available 48-96 hours after online publication and is updated daily on week days.
Initial download of the metrics may take a while.