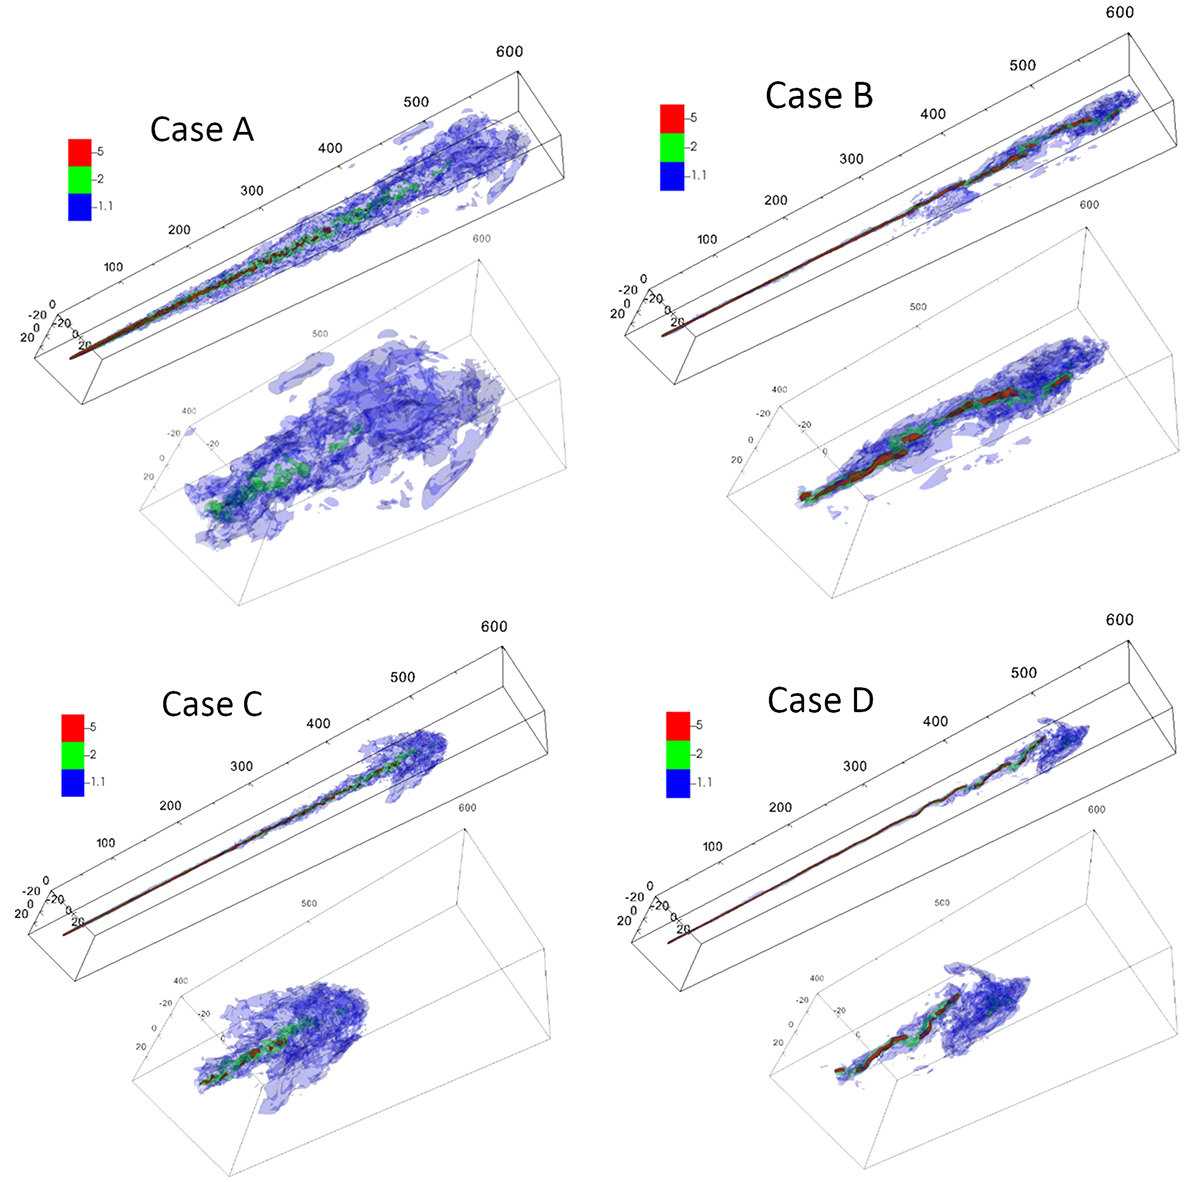
Fig. 2.
Download original image
Three-dimensional isosurfaces of Lorentz factor at the end of the simulations. The top left panel represents Case A at t = 23 000, the top right panel represents Case B at t = 12 000, the bottom left panel represents Case C at t = 42 000, and finally, the bottom right panel represents Case D at t = 48 000. In each panel the top portions display the entire jet while the bottom portions display the last section of the jet between y = 400 and y = 600. The three isosurfaces are for γ = 1.1, 3, 5.
Current usage metrics show cumulative count of Article Views (full-text article views including HTML views, PDF and ePub downloads, according to the available data) and Abstracts Views on Vision4Press platform.
Data correspond to usage on the plateform after 2015. The current usage metrics is available 48-96 hours after online publication and is updated daily on week days.
Initial download of the metrics may take a while.