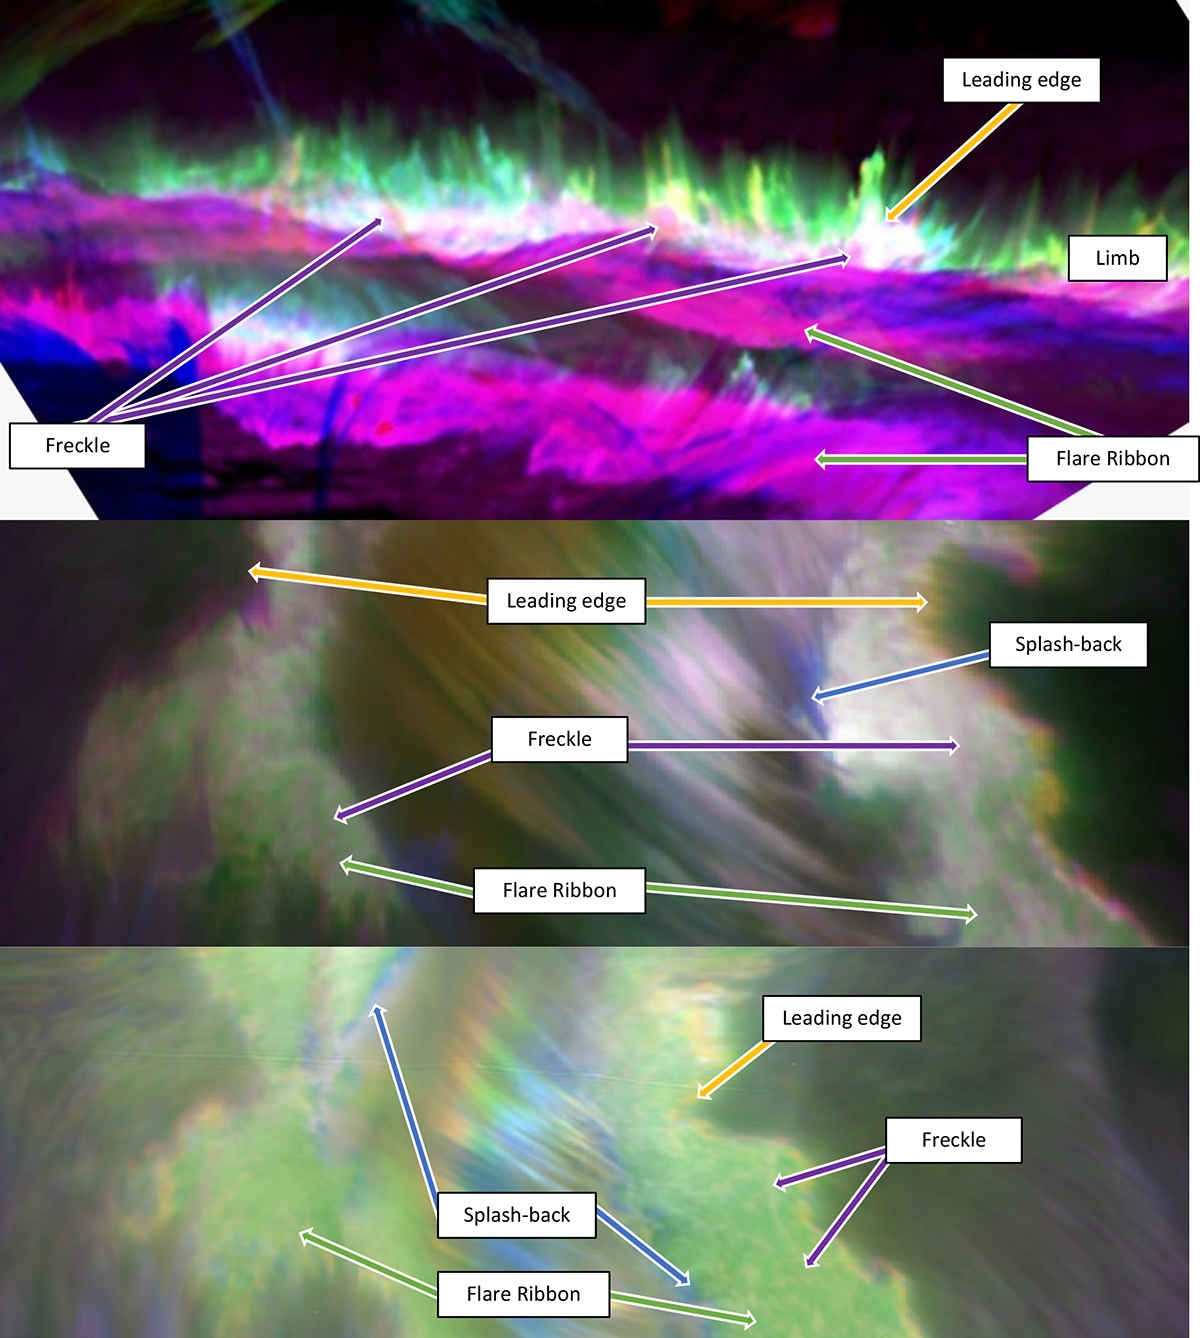
Fig. 7.

Download original image
Comparison between two COCOPLOTS of X-class flares in edge-on, and top-down views with the described region types pointed out from a top-down and sideways view. Top: Two-ribbon X1.5-class flare seen in Hα at the solar limb in the NOAA Active Region NOAA 12087 observed with CRISP at the SST on June 10 2014 at 12:52 UT. The data for this flare is comprehensively described in Singh et al. (2024). Middle: Hα observations of our X9.3-class flare. Bottom: Ca II 8542 Å observations of our X9.3-class flare.
Current usage metrics show cumulative count of Article Views (full-text article views including HTML views, PDF and ePub downloads, according to the available data) and Abstracts Views on Vision4Press platform.
Data correspond to usage on the plateform after 2015. The current usage metrics is available 48-96 hours after online publication and is updated daily on week days.
Initial download of the metrics may take a while.


