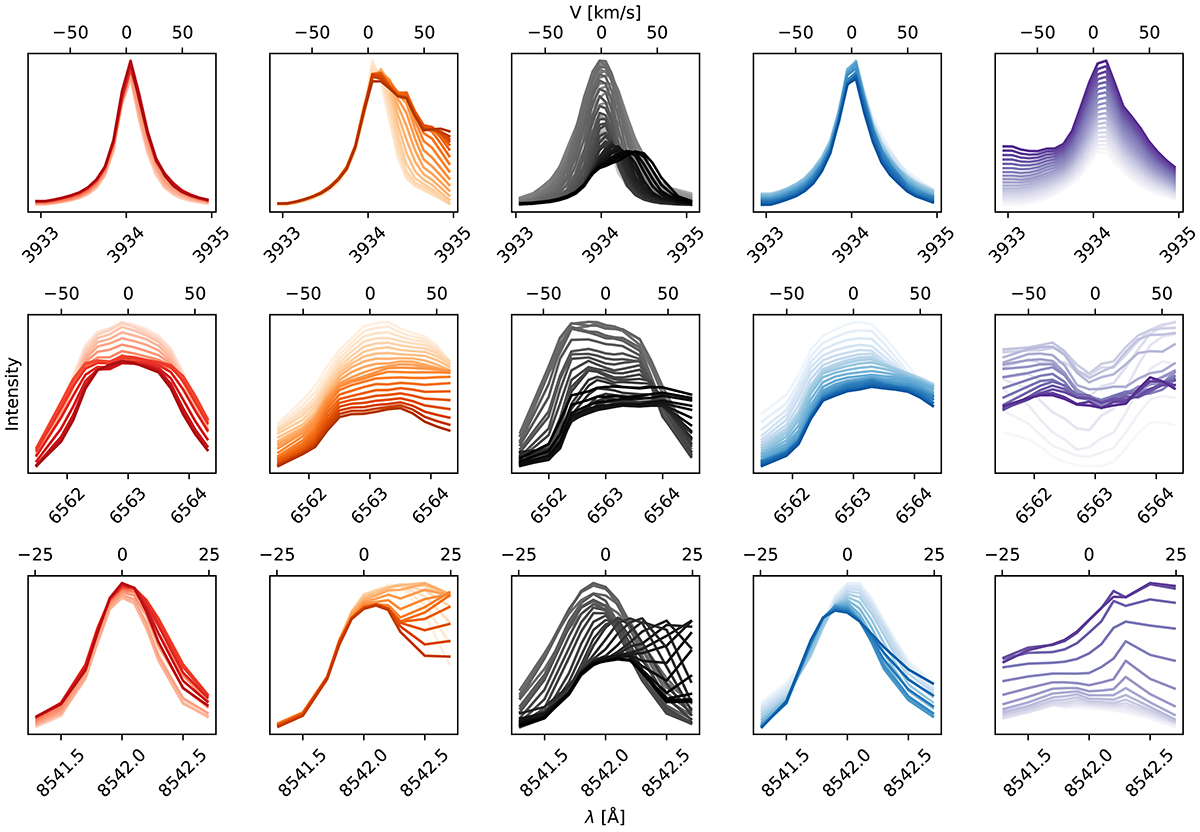
Fig. 4.

Download original image
Spectra of each feature described in Fig. 3 compared to their surroundings. The top row shows the Ca II K spectral lines, the middle row shows Hα, and the bottom row shows Ca II 8542 Å. The left column shows in red these spectra for the red slit from Fig. 1 placed over a ribbon freckle. The second column shows in orange the results for the leading edge of a flare ribbon. The third column shows in gray the spectra for the slit tracing the trajectory of a flare loop, which shows coronal down-flows over a ribbon area in the line of sight. The fourth column shows spectra in blue for profiles at the base of the coronal rain loops. The fifth column shows broad profiles. The darkest line in each of the panels is the spectral line shape from the pixel in the middle of each structure selected for examination, and the lighter lines represent the spectra as one moves out from this feature along the slit indicated in Fig. 3.
Current usage metrics show cumulative count of Article Views (full-text article views including HTML views, PDF and ePub downloads, according to the available data) and Abstracts Views on Vision4Press platform.
Data correspond to usage on the plateform after 2015. The current usage metrics is available 48-96 hours after online publication and is updated daily on week days.
Initial download of the metrics may take a while.


