Fig. 3.

Download original image
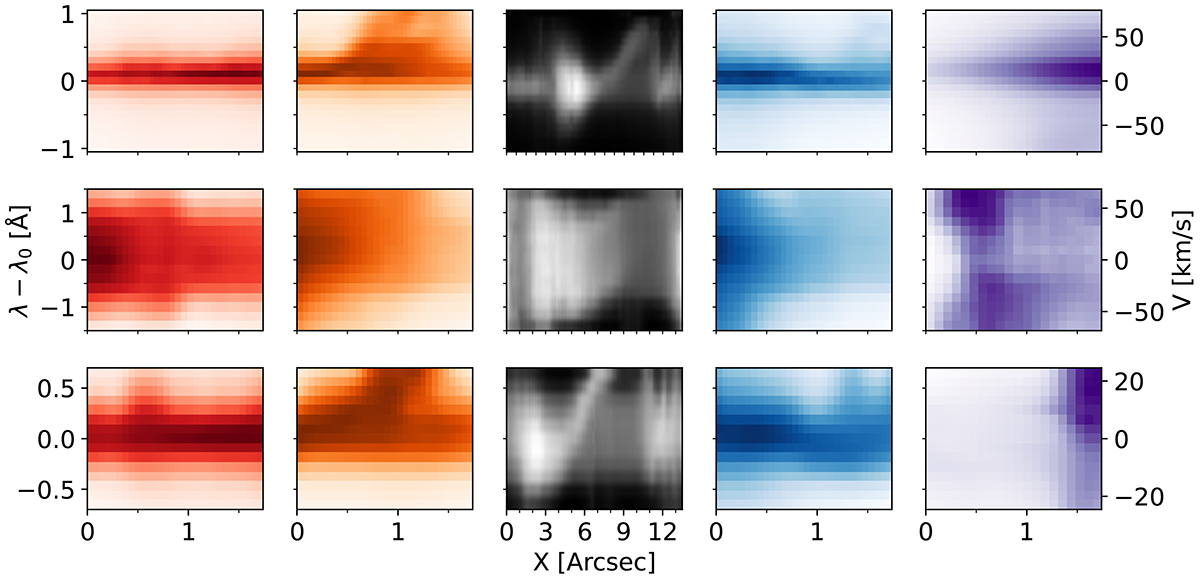
Spectral profiles of the cross-section indicated in Figs. 1 and 2. Each vertical set of three panels corresponds to the Ca II K, Hα, and Ca II 8542 Å respectively, with each column corresponding to the cross-section of the same color shown in Fig. 1 or Fig. 2. Left column, in red: Ribbon freckle at x ≈ 0.65 arcsec. Second column, in orange: The leading edge of the flare ribbon at x ≈ 0.3 arcsec. Third column, in grey: Cut tracing the trajectory of a coronal loop with condensed rain flowing down towards the flare ribbon. Fourth column, in blue: Profiles from the part of the ribbon near the base of a coronal loop down-flow crossing a region showing blueshifted profiles. Fourth column, in magenta: Broad profiles found in the early stages of the flare.
Current usage metrics show cumulative count of Article Views (full-text article views including HTML views, PDF and ePub downloads, according to the available data) and Abstracts Views on Vision4Press platform.
Data correspond to usage on the plateform after 2015. The current usage metrics is available 48-96 hours after online publication and is updated daily on week days.
Initial download of the metrics may take a while.


