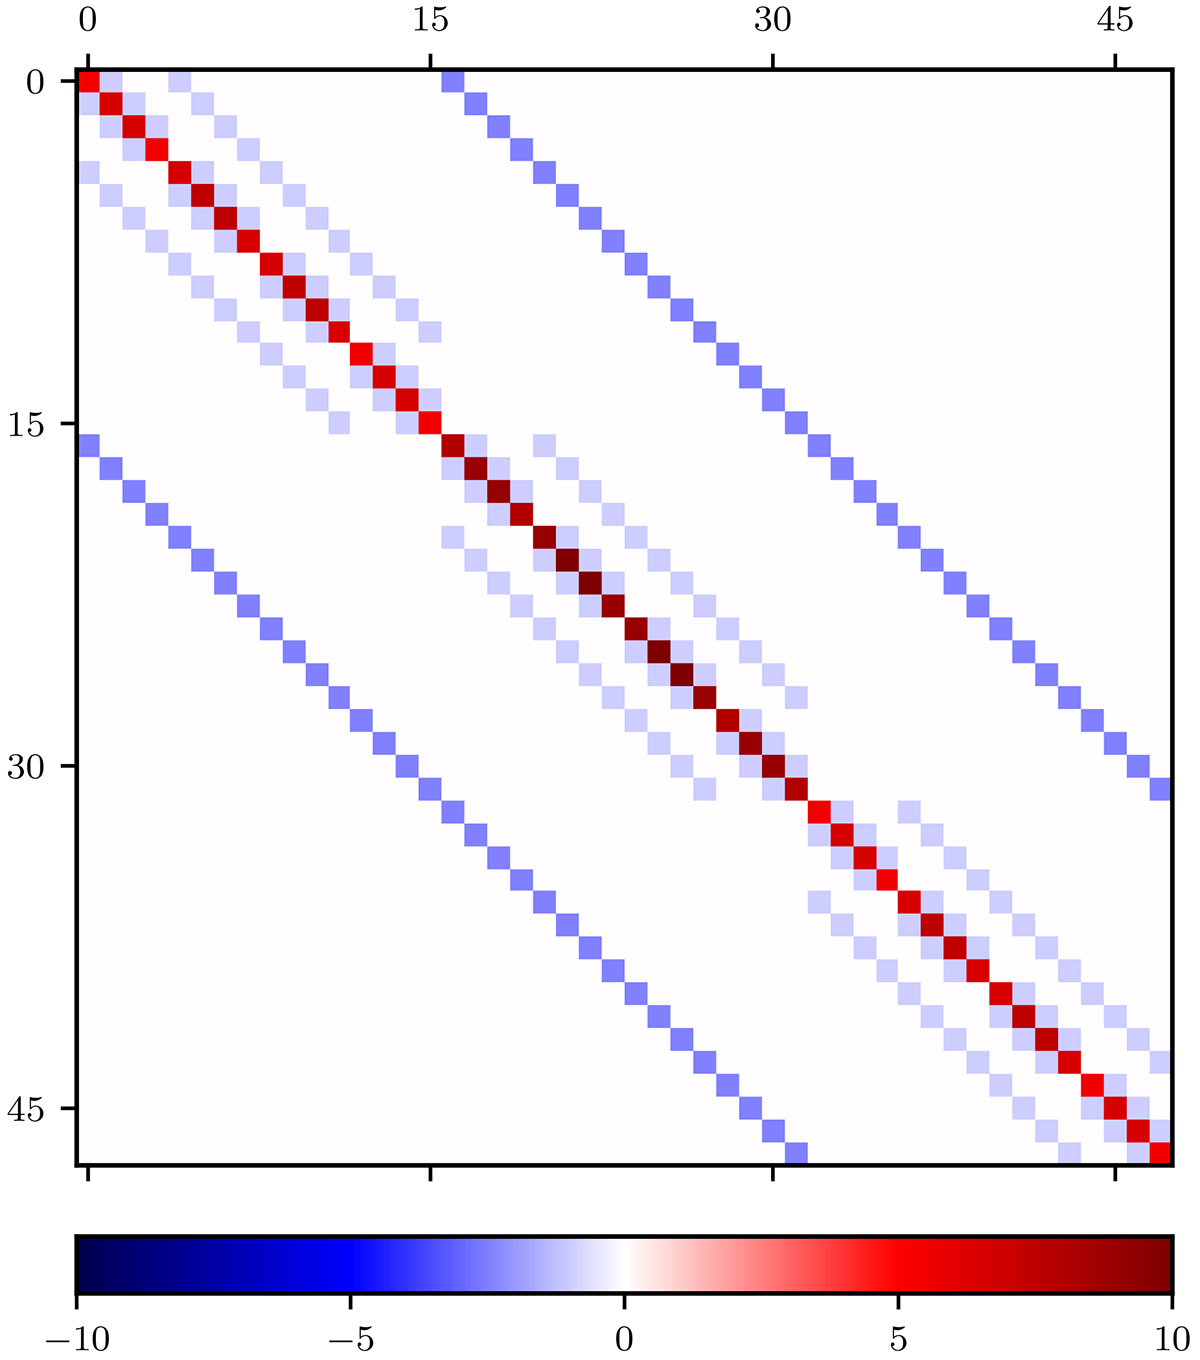
Fig. 2.
Download original image
Regularisation matrix for the linear case. Each row corresponds to the regularisation function for one pixel in space and time. For displaying purposes, we assume an observation with dimensions nt = 3, ny = 4, nx = 4 and regularisation weights α = 1, β = 1, and γ = 2.5. The outermost bands (darker blue) correspond to the temporal regularisation terms, whereas the inner light-blue terms originate from the spatial regularisation.
Current usage metrics show cumulative count of Article Views (full-text article views including HTML views, PDF and ePub downloads, according to the available data) and Abstracts Views on Vision4Press platform.
Data correspond to usage on the plateform after 2015. The current usage metrics is available 48-96 hours after online publication and is updated daily on week days.
Initial download of the metrics may take a while.