Fig. 3
Download original image
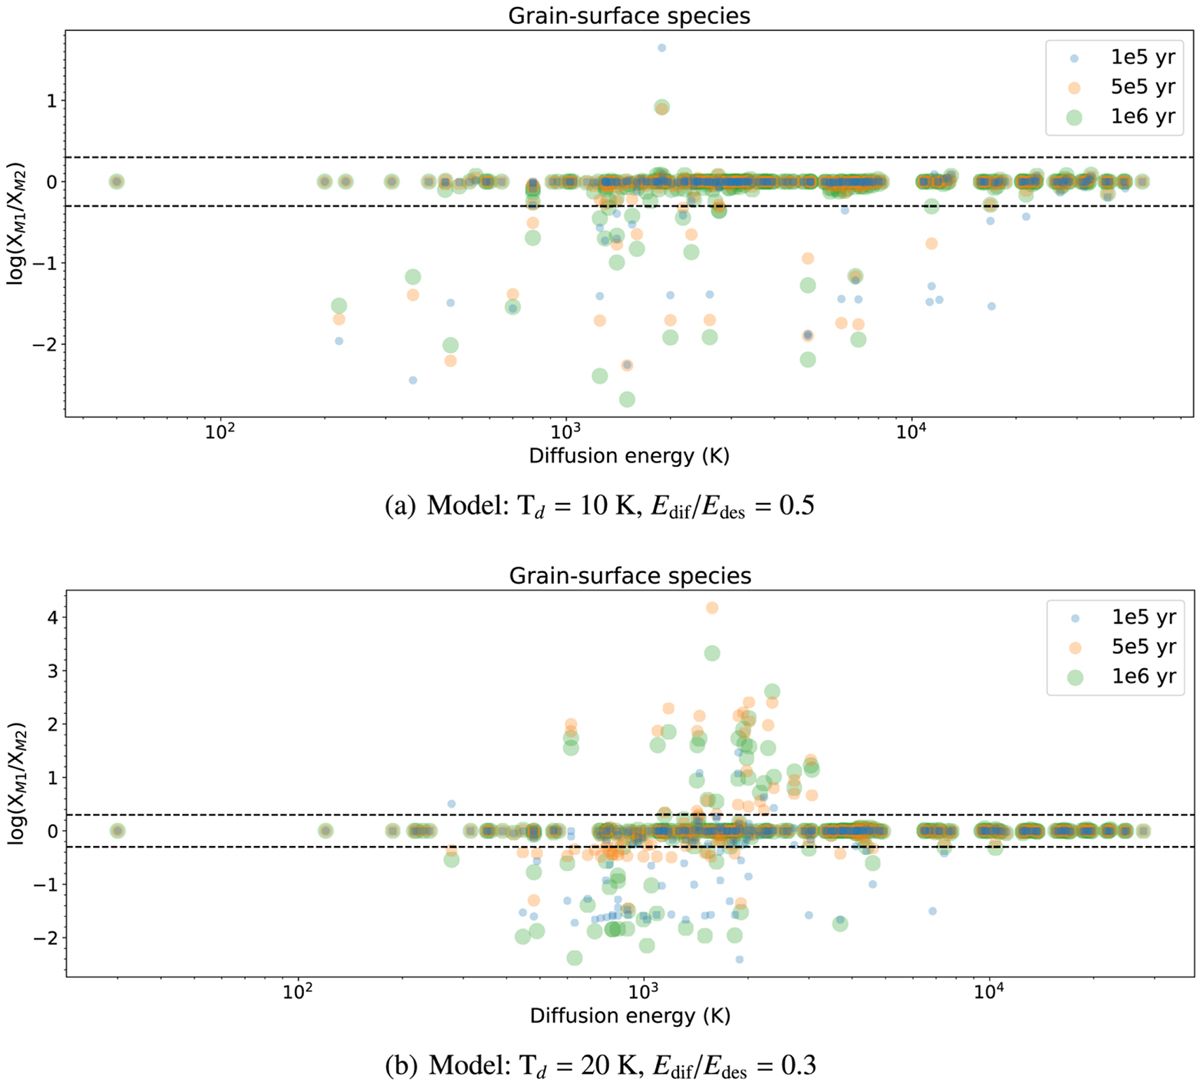
Distributions of the logarithmic molecular abundance ratio of M1 and M2 for the gas-phase species and grain species as a function of their diffusion energy at the three different evolutionary times. These results are under the assumption that there is no difference when the abundance is lower than 10−14 for a species in the two models. Panel a shows model parameters with a grain temperature Td = 10 K and Edif/Edes = 0.5, and panel b shows Td = 20 K and Edif/Edes = 0.3. XM1 and XM2 represent the abundance of a species in models M1 and M2, respectively. The horizontal dashed lines plot the ±0.3 difference of the logarithmic molecular abundance ratio of M1 and M2.
Current usage metrics show cumulative count of Article Views (full-text article views including HTML views, PDF and ePub downloads, according to the available data) and Abstracts Views on Vision4Press platform.
Data correspond to usage on the plateform after 2015. The current usage metrics is available 48-96 hours after online publication and is updated daily on week days.
Initial download of the metrics may take a while.