Fig. 1
Download original image
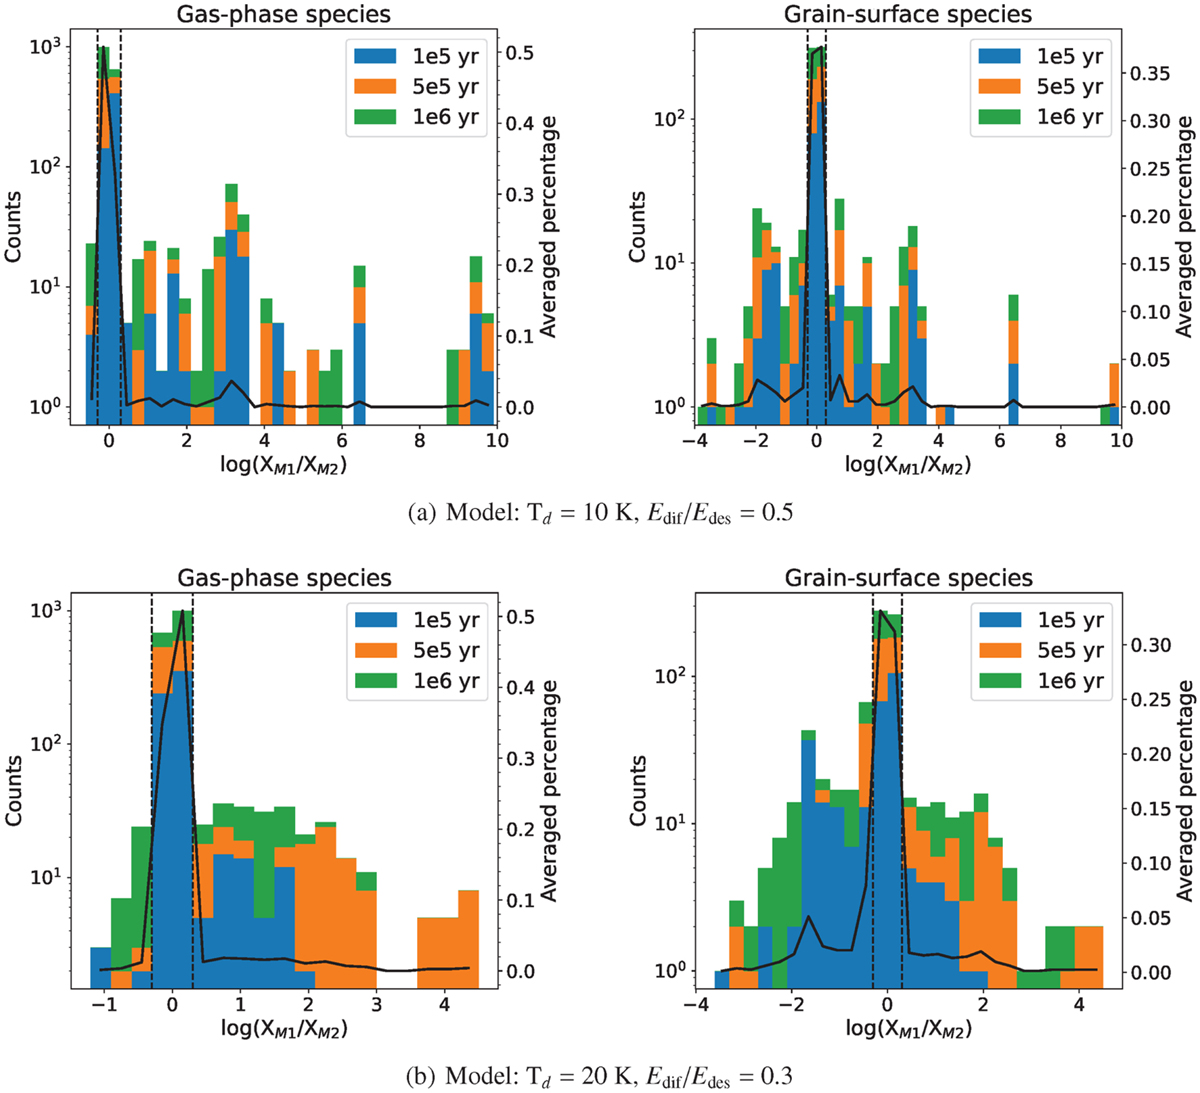
Statistics of the logarithmic molecular abundance ratio of M1 and M2 for the gas-phase species and grain species at the three different evolutionary times. Panel a shows modeling parameters with a grain temperature Td = 10 K and Edif/Edes = 0.5, and panel b shows Td = 20 K and Edif/Edes = 0.3. XM1 and XM2 represent the abundance of a species in models M1 and M2, respectively. The solid lines represent the relative percentage of each bin with respect to the total number of the gas-phase or grain species averaged over the three different times. The width of each bin is 0.3.
Current usage metrics show cumulative count of Article Views (full-text article views including HTML views, PDF and ePub downloads, according to the available data) and Abstracts Views on Vision4Press platform.
Data correspond to usage on the plateform after 2015. The current usage metrics is available 48-96 hours after online publication and is updated daily on week days.
Initial download of the metrics may take a while.