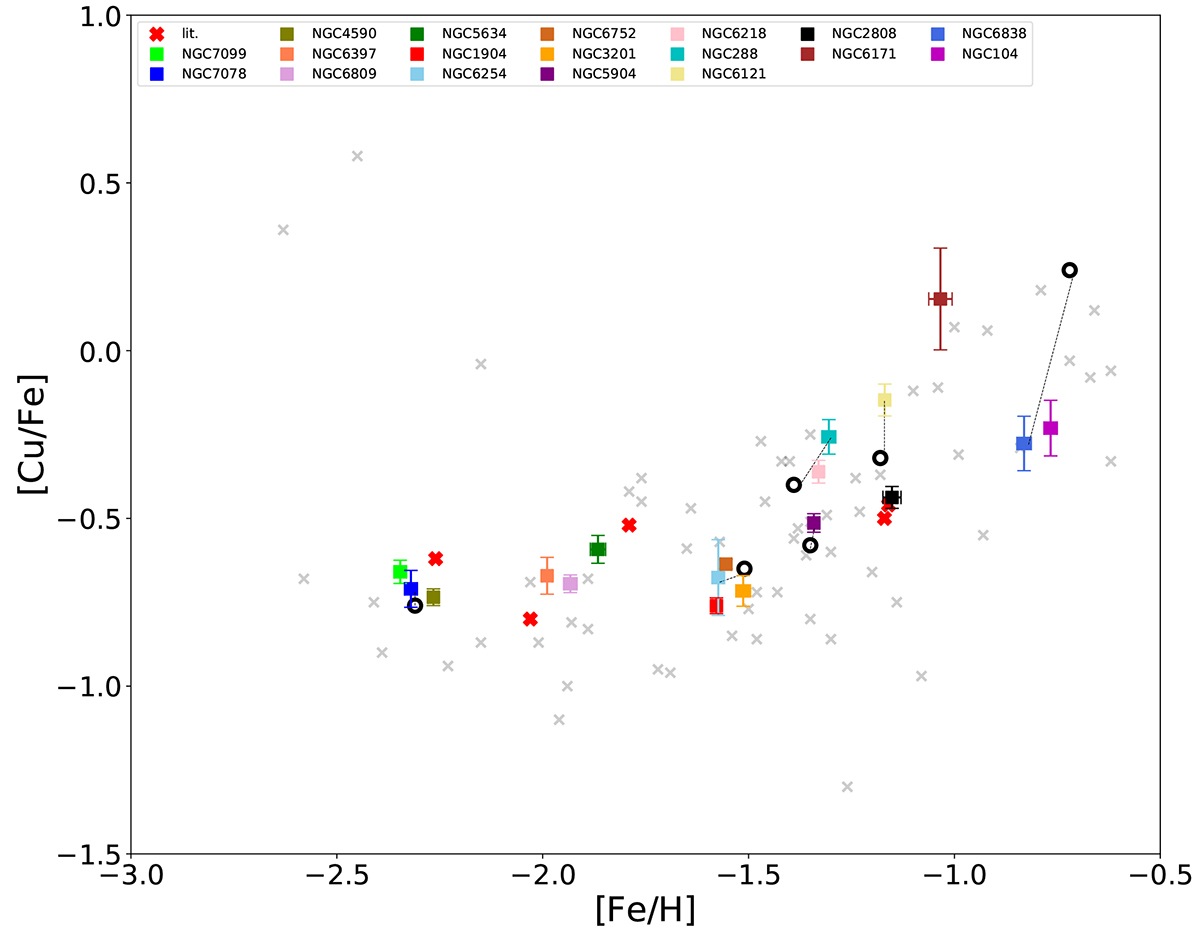
Fig. 5.
Download original image
[Cu/Fe] distribution along the [Fe/H] for the whole sample. The analysed GCs are shown with coloured squares. Grey crosses show the field star abundances from Ishigaki et al. (2013). Red-filled crosses display the reported abundance of Cu in different GCs in the literature. Black circles represent results reported by Simmerer et al. (2003) for our in-common GCs (linked with a black dashed line).
Current usage metrics show cumulative count of Article Views (full-text article views including HTML views, PDF and ePub downloads, according to the available data) and Abstracts Views on Vision4Press platform.
Data correspond to usage on the plateform after 2015. The current usage metrics is available 48-96 hours after online publication and is updated daily on week days.
Initial download of the metrics may take a while.