Fig. 13.
Download original image
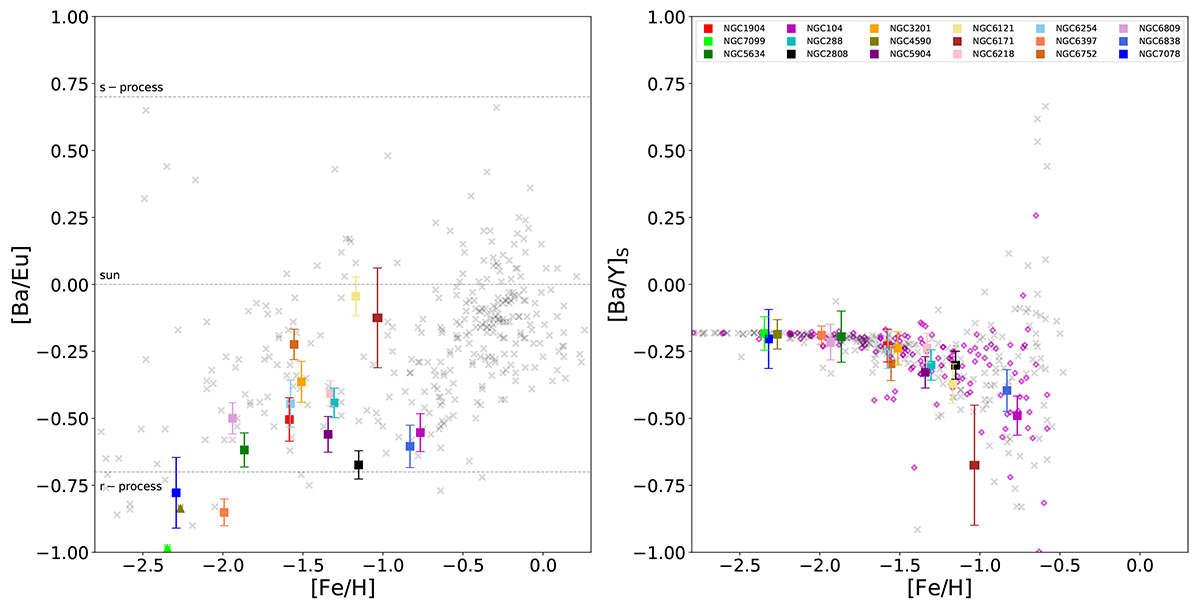
Abundance ratios of [Ba/Eu] and [Ba/Y]s as a function of [Fe/H], respectively, shown in the left and right panels. Dashed lines at [Ba/Eu] 0.70 dex and −0.70 dex indicate the ratio for a full s-process and full r-process enrichment. The dashed line at [Ba/Eu] 0.00 dex displays the solar ratio. Magenta diamonds in the right-hand panel show dwarf galaxies results taken from Suda et al. (2008). Other symbols and colours follow the description given in Fig. 12.
Current usage metrics show cumulative count of Article Views (full-text article views including HTML views, PDF and ePub downloads, according to the available data) and Abstracts Views on Vision4Press platform.
Data correspond to usage on the plateform after 2015. The current usage metrics is available 48-96 hours after online publication and is updated daily on week days.
Initial download of the metrics may take a while.