Fig. 9.
Download original image
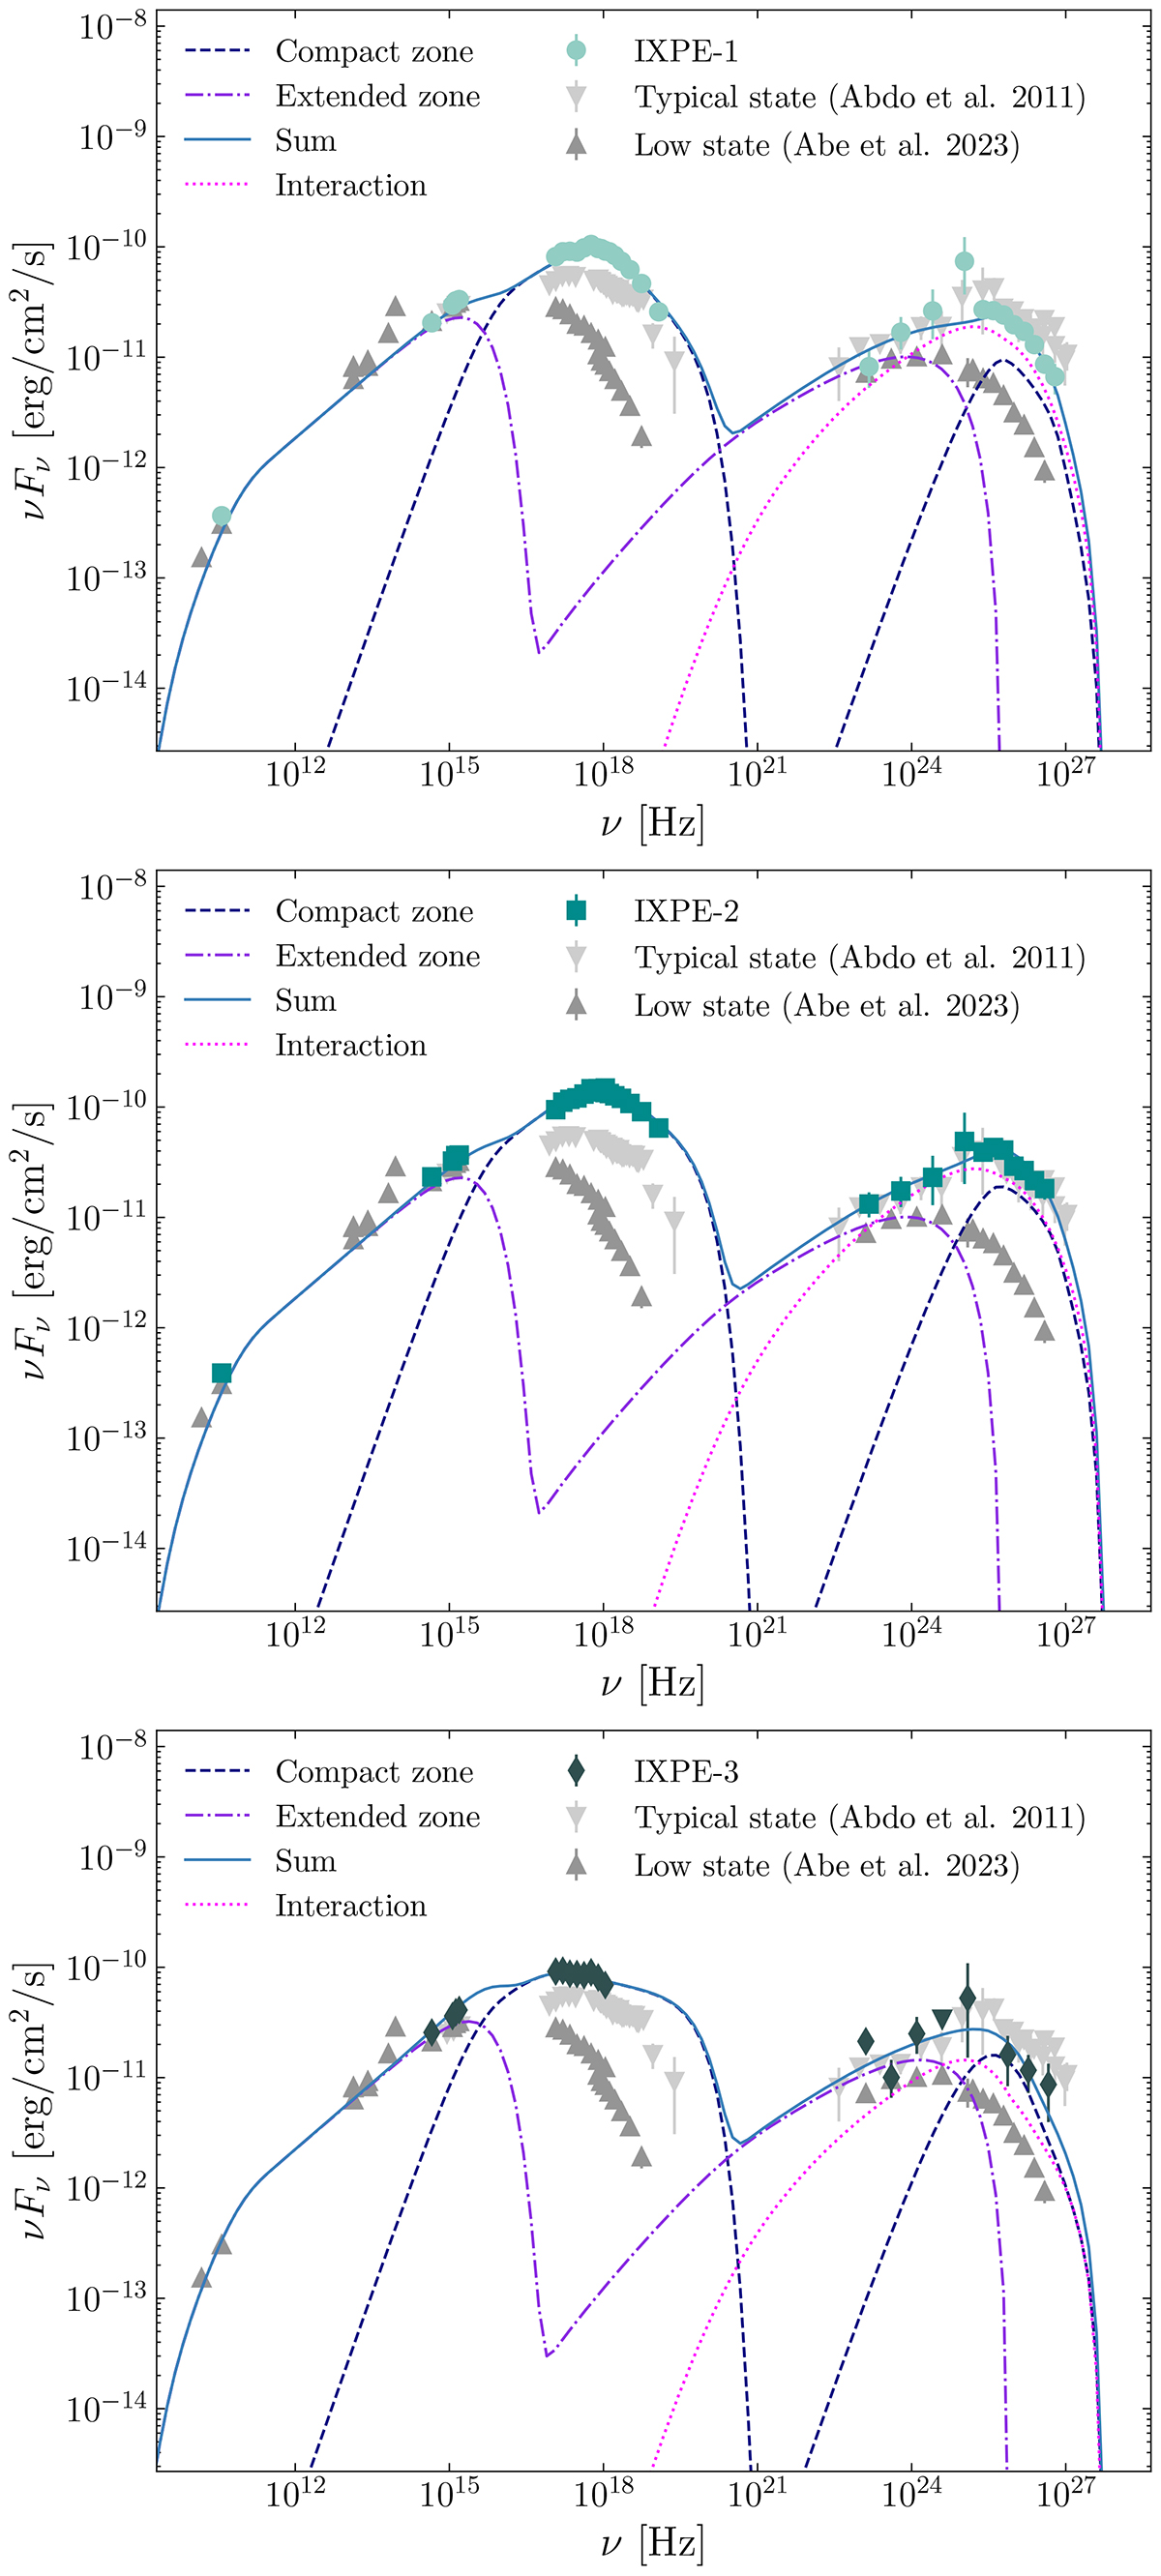
Modeling of the three IXPE epochs: IXPE-1 (top), IXPE-2 (middle), and IXPE-3 (bottom). The dashed blue curve is the emission originating from the compact zone, located near the shock front. The dashed-dotted violet curve is the contribution from the extended zone, which spans a larger volume downstream from the shock. The emission resulting from the interaction between the two zones is plotted as a dotted pink curve. The sum of all components is given by the solid blue line. The light gray and dark gray markers show the average state (from Abdo et al. 2011) and low state (from Abe et al. 2023), respectively. The parameters of the model are listed in Table 3.
Current usage metrics show cumulative count of Article Views (full-text article views including HTML views, PDF and ePub downloads, according to the available data) and Abstracts Views on Vision4Press platform.
Data correspond to usage on the plateform after 2015. The current usage metrics is available 48-96 hours after online publication and is updated daily on week days.
Initial download of the metrics may take a while.