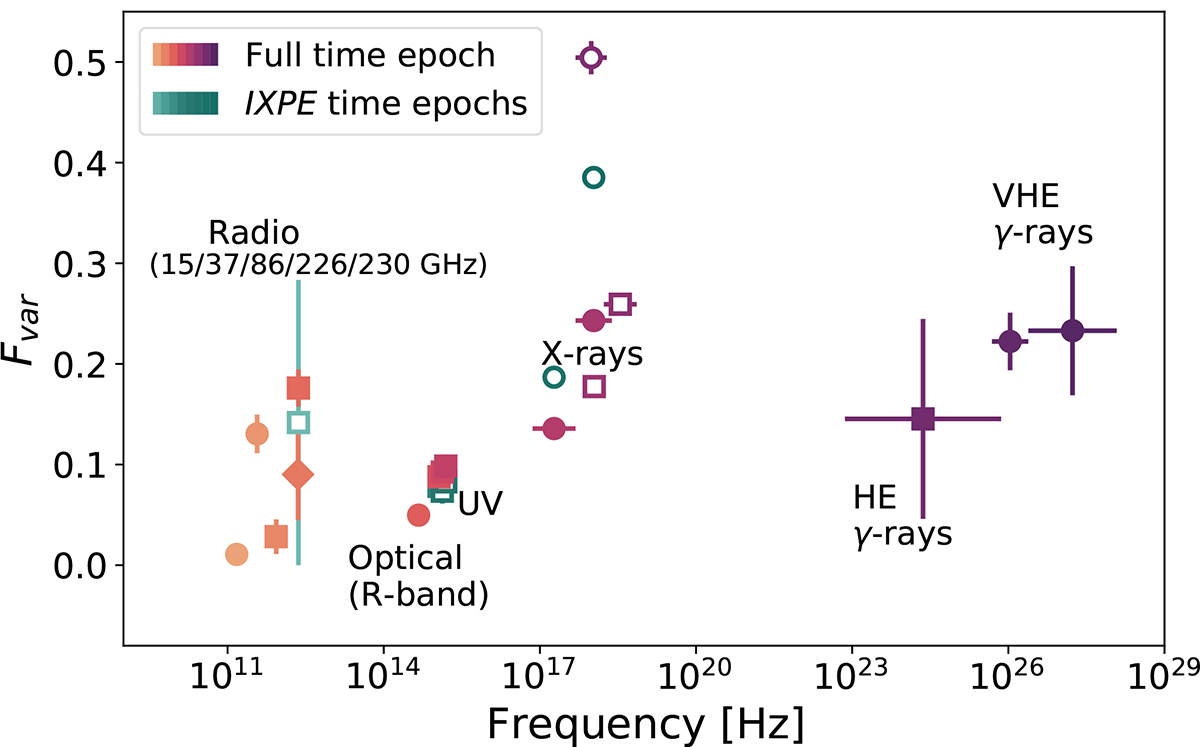
Fig. 5.
Download original image
Fractional variability for the LCs displayed in Fig. 1. Nightly bins are used for MAGIC and 7-day bins for Fermi-LAT; for all other wavebands, the single observations without further binning are used. For the radio data, frequencies are stated to distinguish between the different datasets (from left to right: the orange circles depict OVRO at 15 GHz and Metsähovi at 37 GHz, the lighter orange square the IRAM data at 86 GHz, the orange diamond SMA at 226 GHz, and the darker orange square and open turquoise square IRAM at 230 GHz). The open purple markers refer to the NuSTAR (square) and IXPE (round) observations, which only consist of two or three measurements and therefore far fewer data points than considered for the full time epoch. Due to the different sampling, not all instruments are directly comparable with each other.
Current usage metrics show cumulative count of Article Views (full-text article views including HTML views, PDF and ePub downloads, according to the available data) and Abstracts Views on Vision4Press platform.
Data correspond to usage on the plateform after 2015. The current usage metrics is available 48-96 hours after online publication and is updated daily on week days.
Initial download of the metrics may take a while.