Fig. C.2.
Download original image
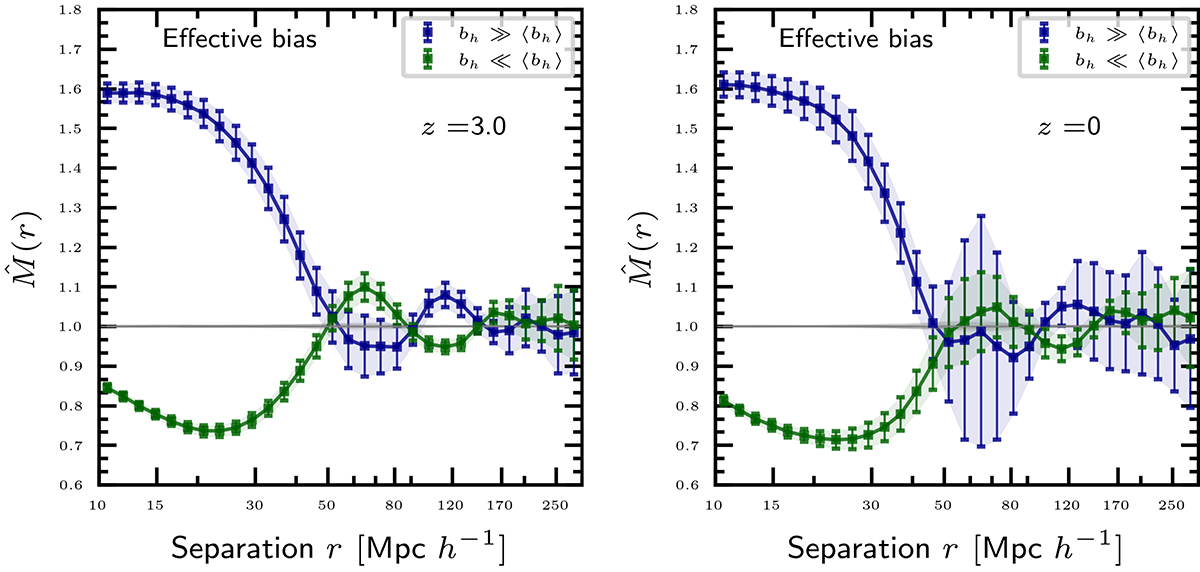
Ranked mark correlation function ![]() using the ranks of the effective bias as a mark for two different redshifts in the UNITSim. The dots with error bars show both the result using tracers with effective bias much larger (or lower) than the mean bias of the sample. The gray lines denote the measurements of the ranked-mark correlation function after randomizing the marks among the tracers.
using the ranks of the effective bias as a mark for two different redshifts in the UNITSim. The dots with error bars show both the result using tracers with effective bias much larger (or lower) than the mean bias of the sample. The gray lines denote the measurements of the ranked-mark correlation function after randomizing the marks among the tracers.
Current usage metrics show cumulative count of Article Views (full-text article views including HTML views, PDF and ePub downloads, according to the available data) and Abstracts Views on Vision4Press platform.
Data correspond to usage on the plateform after 2015. The current usage metrics is available 48-96 hours after online publication and is updated daily on week days.
Initial download of the metrics may take a while.