Fig. 10.
Download original image
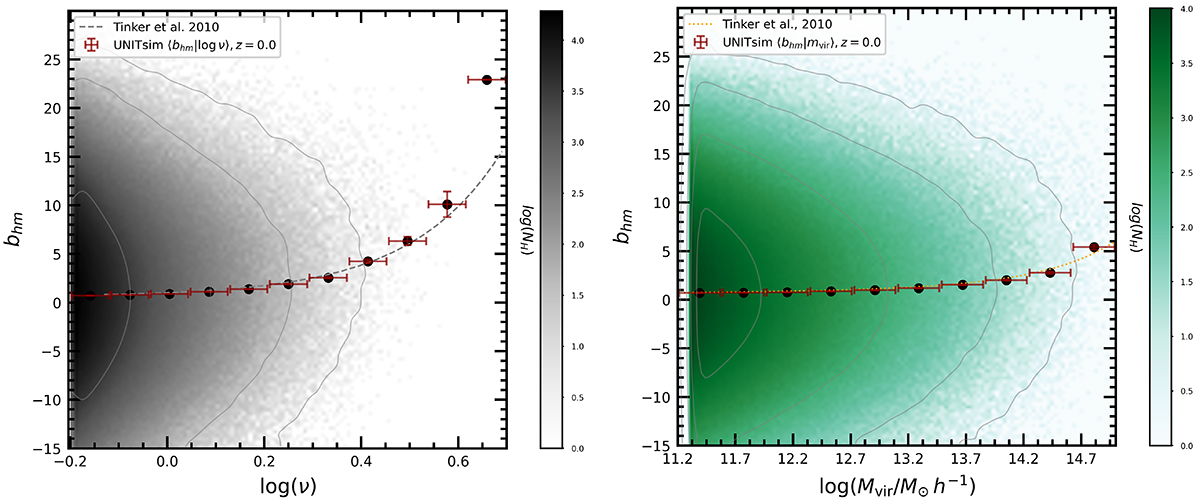
Halo effective bias bhm computed with Eq. (10) at z = 0. Left panel: Bias as a function of the halo peak height; the points denote the mean bias in different ν bins, and the error bars denote the standard error of the mean in each bin. The dotted line shows the prediction of Tinker et al. (2010). Right panel: Halo bias bhm as a function of the halo virial mass. In both cases, the contours indicate a region of an equal number of tracers NH.
Current usage metrics show cumulative count of Article Views (full-text article views including HTML views, PDF and ePub downloads, according to the available data) and Abstracts Views on Vision4Press platform.
Data correspond to usage on the plateform after 2015. The current usage metrics is available 48-96 hours after online publication and is updated daily on week days.
Initial download of the metrics may take a while.