Fig. D.1

Download original image
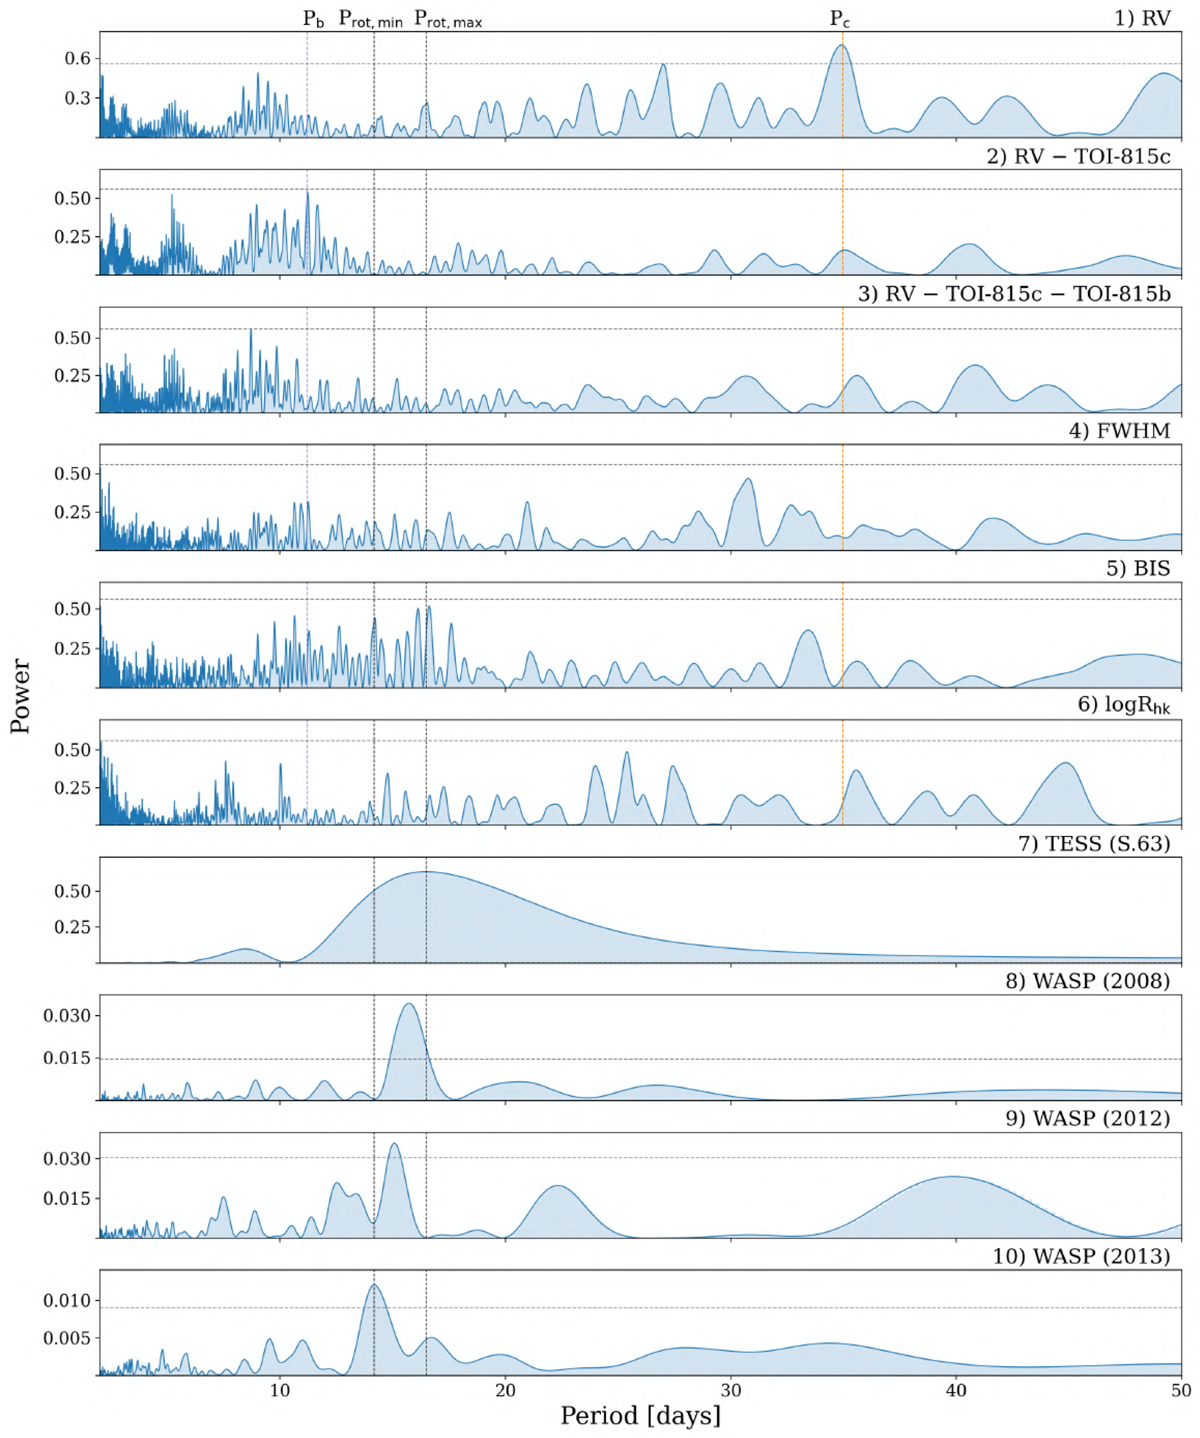
GLS periodogram of the TOI-815 spectroscopic and photometric time series. More specifically: (1) RV ESPRESSO measurements, (2) RV residuals, after the subtraction of TOI-815c signal, (2) RV residuals, after the subtraction of TOI-815b and c signals, (3)-(5) FWHM, bisector, and Ca II H & K line activity indicator (logR′HK), (7) TESS Sector 63 photometric data, and (8)-(10) WASP photometric data (2008, 2012, and 2023). The two black vertical lines correspond to the minimum and maximum rotation periods (Prot,mim ~ 14.2 days and Prot,max ~ 16.5 days). The purple and orange vertical lines correspond to the orbital periods of planets b (Pb ~ 11.2 days) and c (Pc ~ 35 days), respectively. The gray horizontal lines indicating the 1% FAP.
Current usage metrics show cumulative count of Article Views (full-text article views including HTML views, PDF and ePub downloads, according to the available data) and Abstracts Views on Vision4Press platform.
Data correspond to usage on the plateform after 2015. The current usage metrics is available 48-96 hours after online publication and is updated daily on week days.
Initial download of the metrics may take a while.


