Fig. 11
Download original image
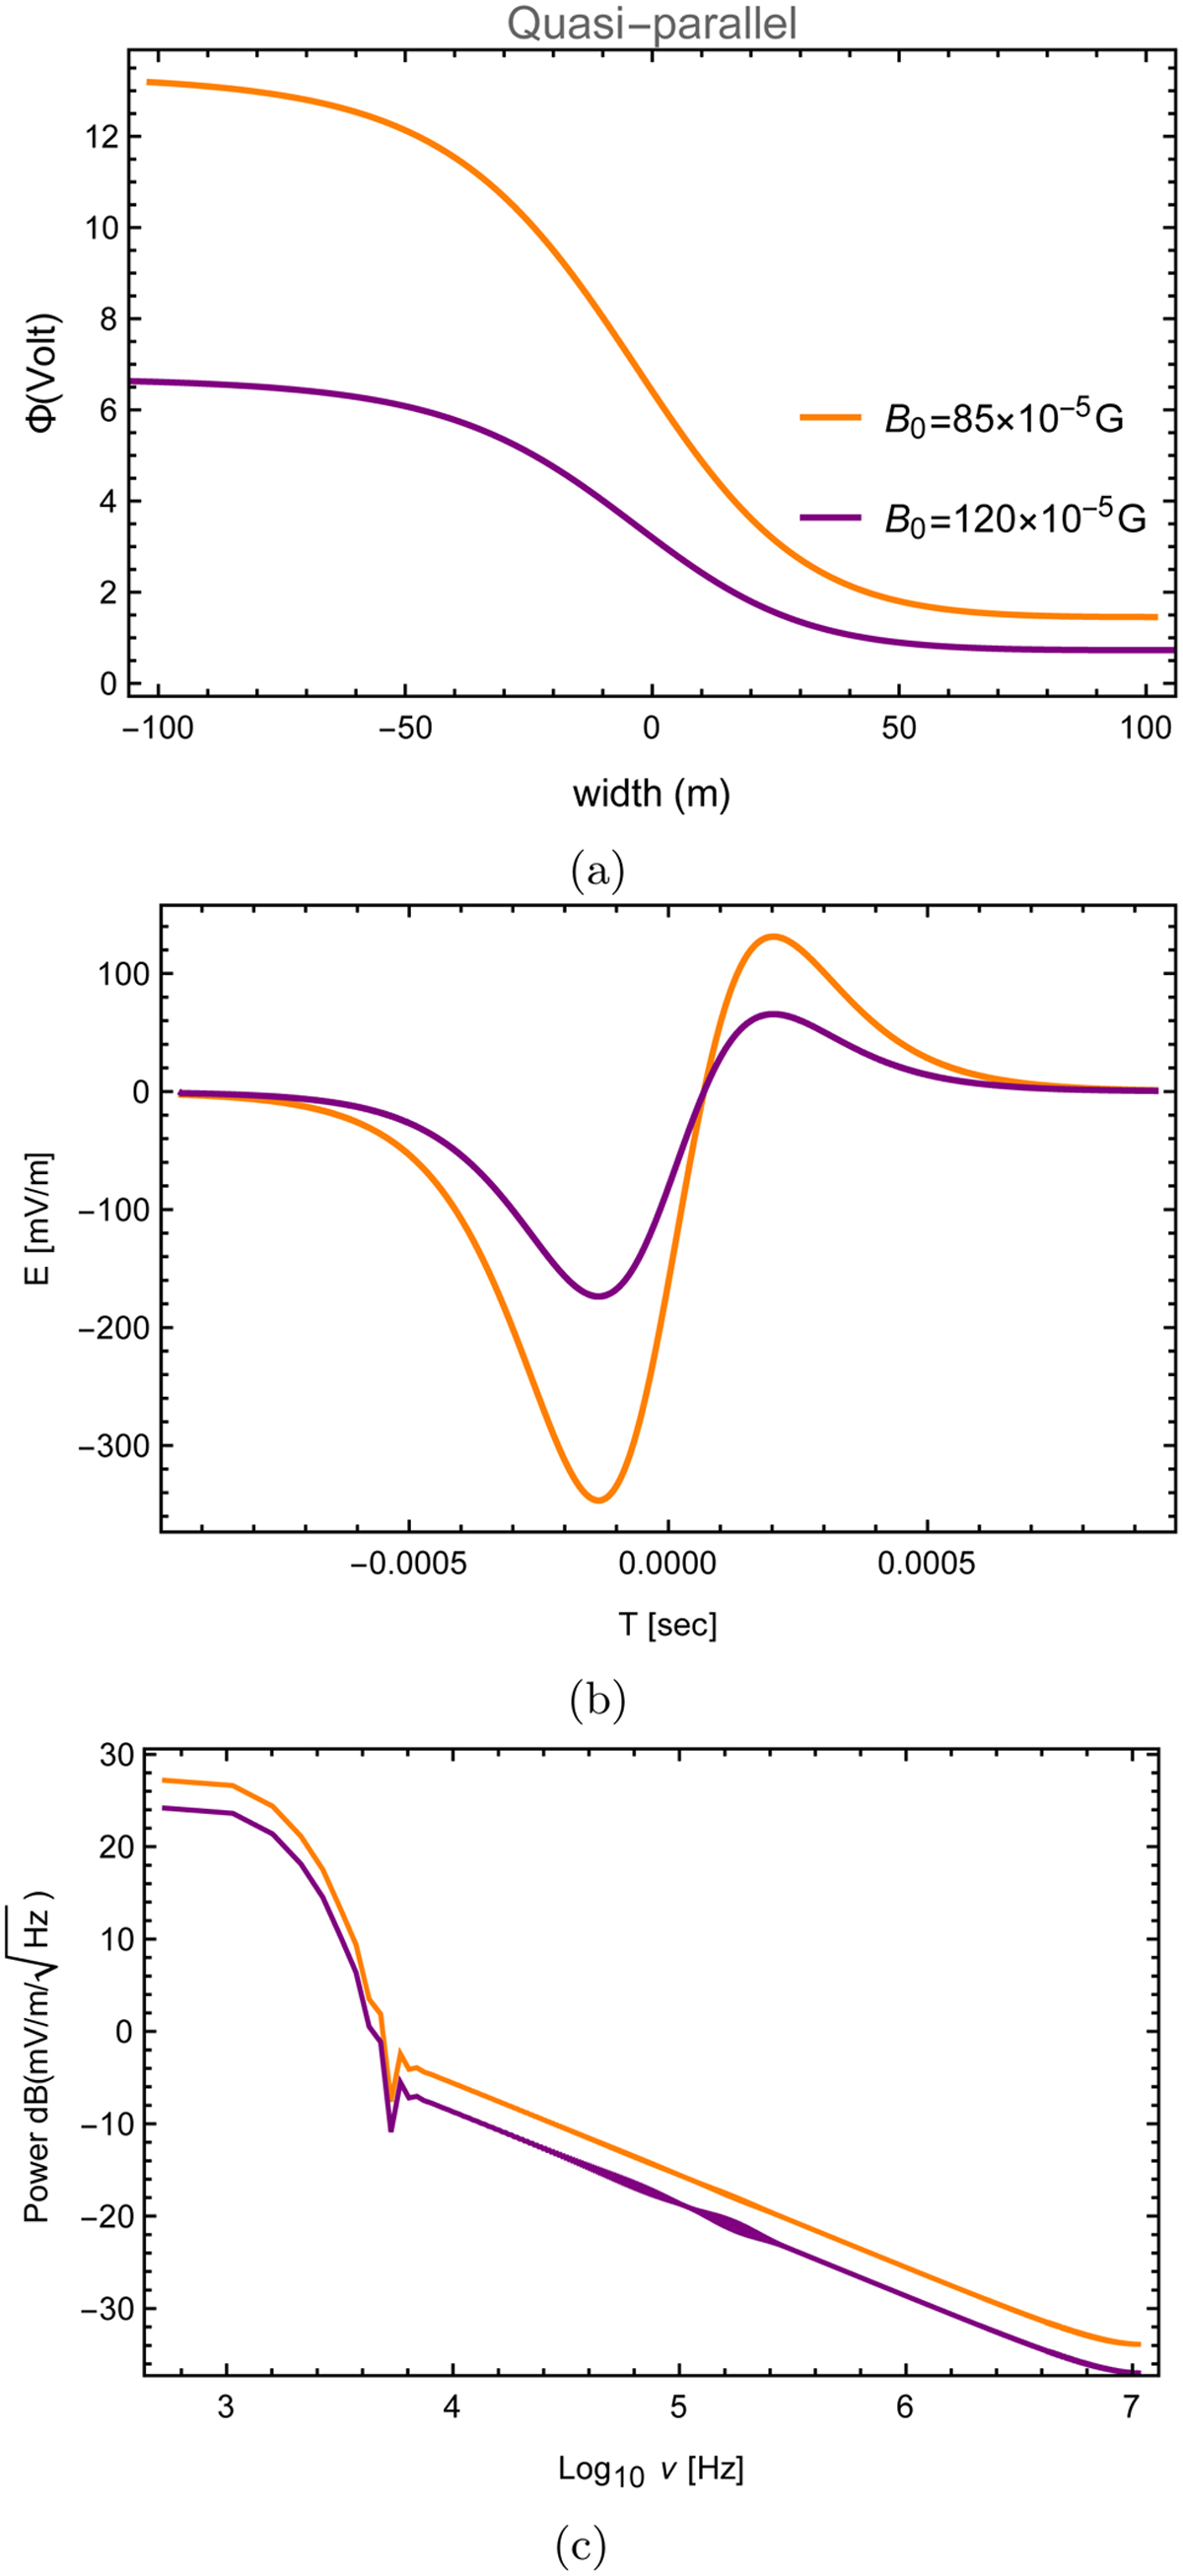
Profile of the quasi-parallel DL with its corresponding electric pulse and the FFT power spectra. (a) DL electrostatic potential expressed in volts (V) in dependence on the spatial width in m. (b) Associated electric pulse for different values of the magnetic field. (c) Corresponding FFT spectra of the electric waveforms, where the x-axis represents log10v, where v is the frequency in Hz, and the y-axis signifies the power of the electric pulse, expressed in decibels dB![]() .
.
Current usage metrics show cumulative count of Article Views (full-text article views including HTML views, PDF and ePub downloads, according to the available data) and Abstracts Views on Vision4Press platform.
Data correspond to usage on the plateform after 2015. The current usage metrics is available 48-96 hours after online publication and is updated daily on week days.
Initial download of the metrics may take a while.