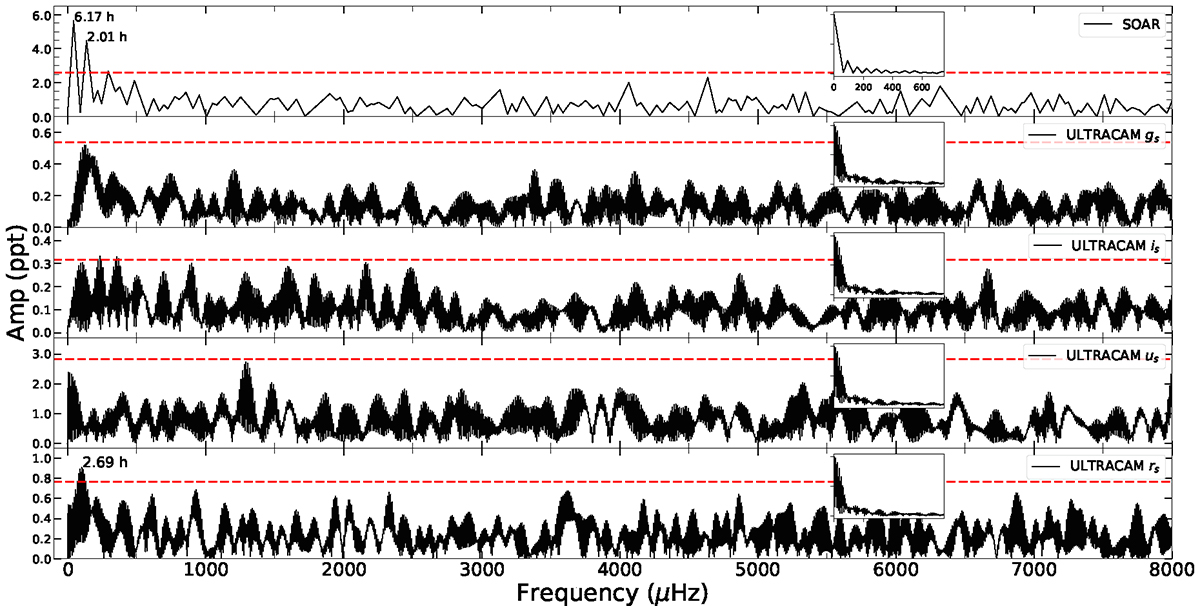
Fig. B.4.
Download original image
For the target J2102-4145 observed with SOAR and ULTRACAM us, gs, is, and rs FT analysis on the residual light curve, obtained after subtracting the light curve fit generated using PHOEBE (details in Section 3.3). The SOAR and ULTRACAM data in us, gs, is, and rs bands were used, mirroring the approach undertaken for Figure B.3. However, in this case, a new PHOEBE model was applied without considering the Doppler beaming effect. This adjustment aimed to investigate and eliminate the possibility that the 1.4-hour signal observed with masked eclipses (see Figure B.2) was caused by the Doppler beaming effect.
Current usage metrics show cumulative count of Article Views (full-text article views including HTML views, PDF and ePub downloads, according to the available data) and Abstracts Views on Vision4Press platform.
Data correspond to usage on the plateform after 2015. The current usage metrics is available 48-96 hours after online publication and is updated daily on week days.
Initial download of the metrics may take a while.