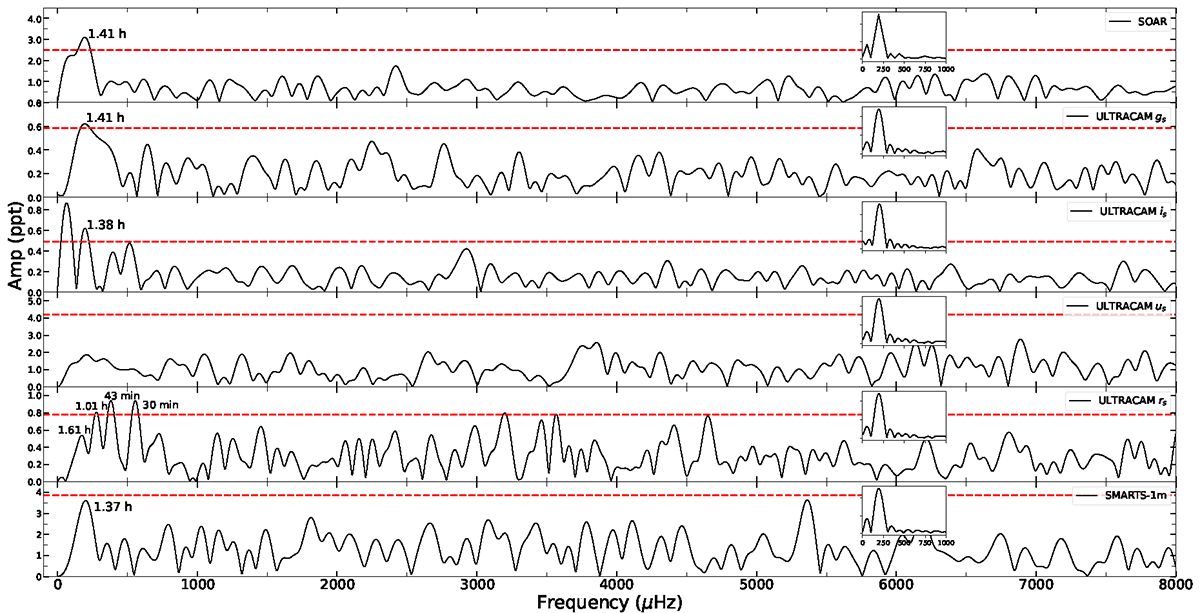
Fig. B.2.
Download original image
FT for J2102-4145, for SOAR, ULTRACAM us, gs, is, rs, and SMARTS-1m observations. The 1/1000 FAP detection limit (red dashed line) was computed using random shuffling of the data. The spectral window for each case is depicted as an inset plot, with the x-axis in μHz and all inset plots being in the same scale. For the rs ULTRACAM data, the combination (f1 + f2)/2 of the periods of 1.61 h (171.872 μHz) and 1.01 hr (274.345 μHz) its half of the orbital period.
Current usage metrics show cumulative count of Article Views (full-text article views including HTML views, PDF and ePub downloads, according to the available data) and Abstracts Views on Vision4Press platform.
Data correspond to usage on the plateform after 2015. The current usage metrics is available 48-96 hours after online publication and is updated daily on week days.
Initial download of the metrics may take a while.