Fig. 5.
Download original image
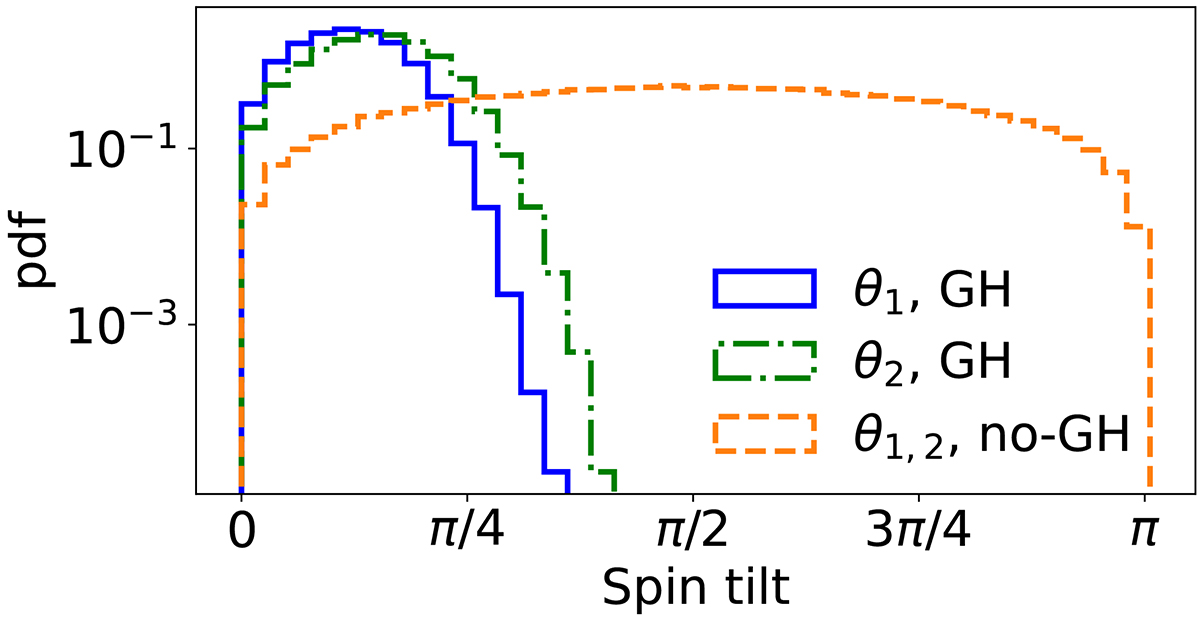
Probability density function (pdf) of spin tilt angles θ1 and θ2. The blue (green) histogram shows the primary (secondary) spin tilt in the GH scenario. The unfilled orange histogram shows the primary and secondary tilts in the no-GH scenario. The first generation is not shown separately in this plot because the distributions are identical at each generation.
Current usage metrics show cumulative count of Article Views (full-text article views including HTML views, PDF and ePub downloads, according to the available data) and Abstracts Views on Vision4Press platform.
Data correspond to usage on the plateform after 2015. The current usage metrics is available 48-96 hours after online publication and is updated daily on week days.
Initial download of the metrics may take a while.