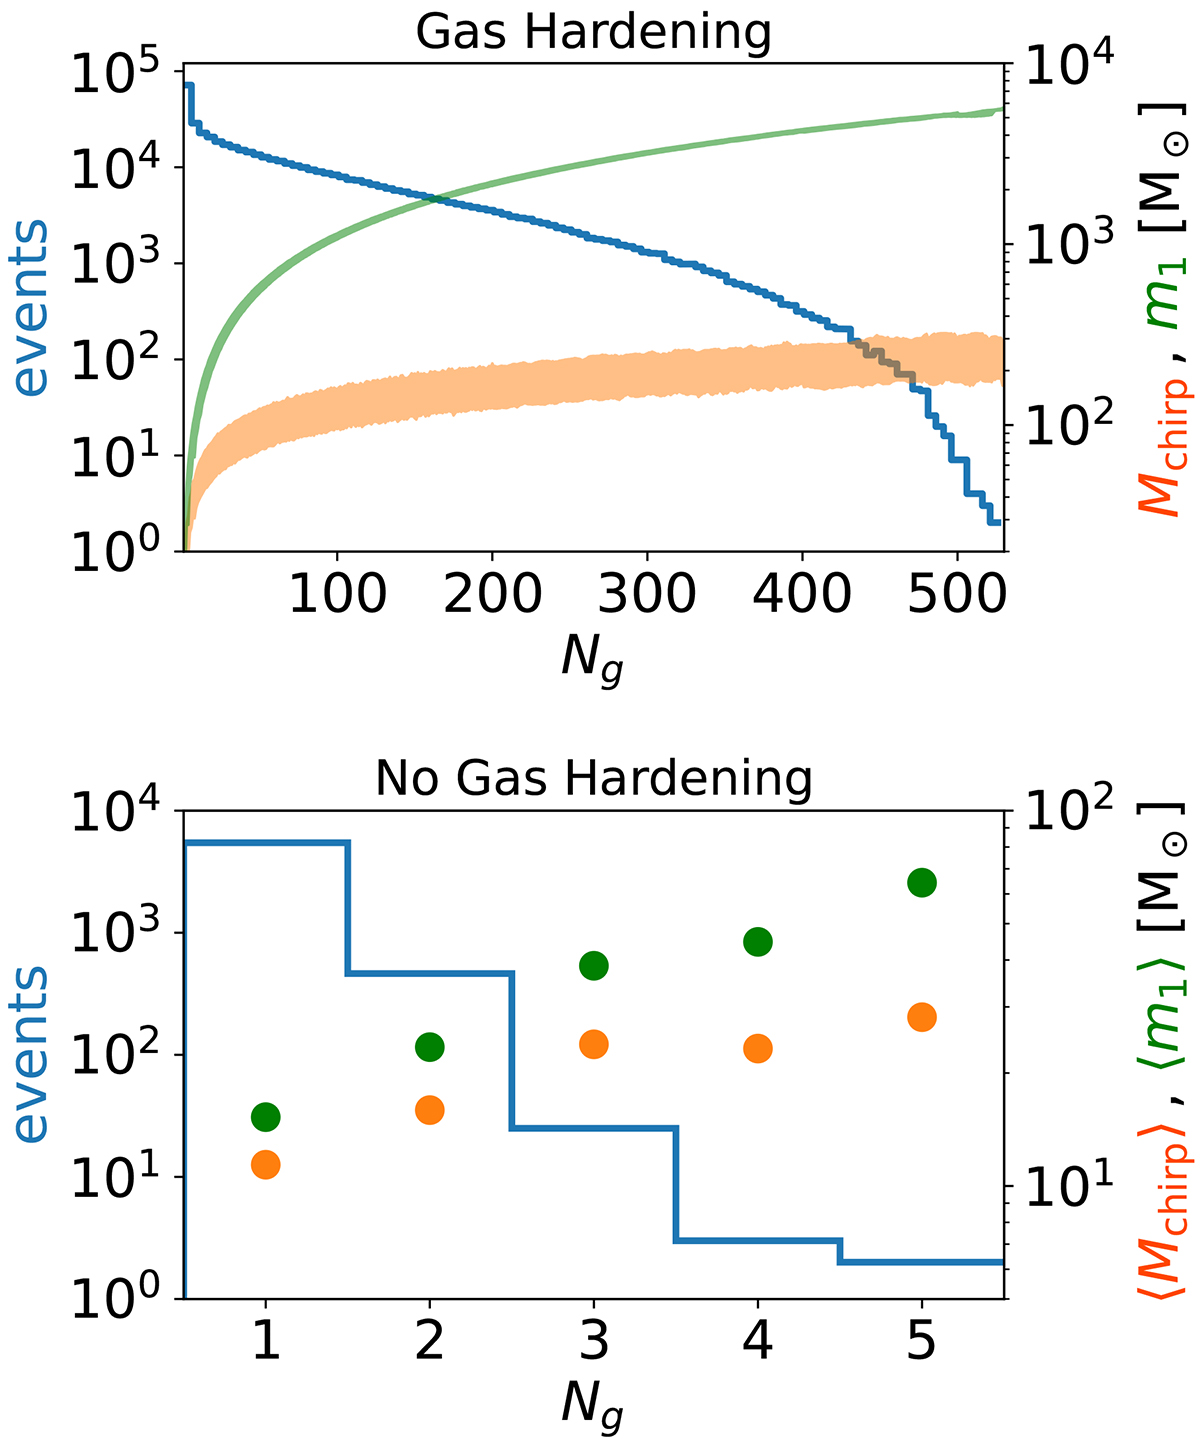
Fig. 3.
Download original image
Number of mergers and characteristic masses at each merger generation. The blue histogram and the left-hand y-axis show the number of BBH merger events for each hierarchical merger generation, Ng. The orange (green) shaded area and the upper right-hand y-axis show the 25%–75% percentile of the chirp mass (primary mass) for merging BBHs of each generation. The orange (green) dots and lower right-hand y-axis show the average chirp mass (primary mass) for merging BBHs of each generation.
Current usage metrics show cumulative count of Article Views (full-text article views including HTML views, PDF and ePub downloads, according to the available data) and Abstracts Views on Vision4Press platform.
Data correspond to usage on the plateform after 2015. The current usage metrics is available 48-96 hours after online publication and is updated daily on week days.
Initial download of the metrics may take a while.