Fig. 15.
Download original image
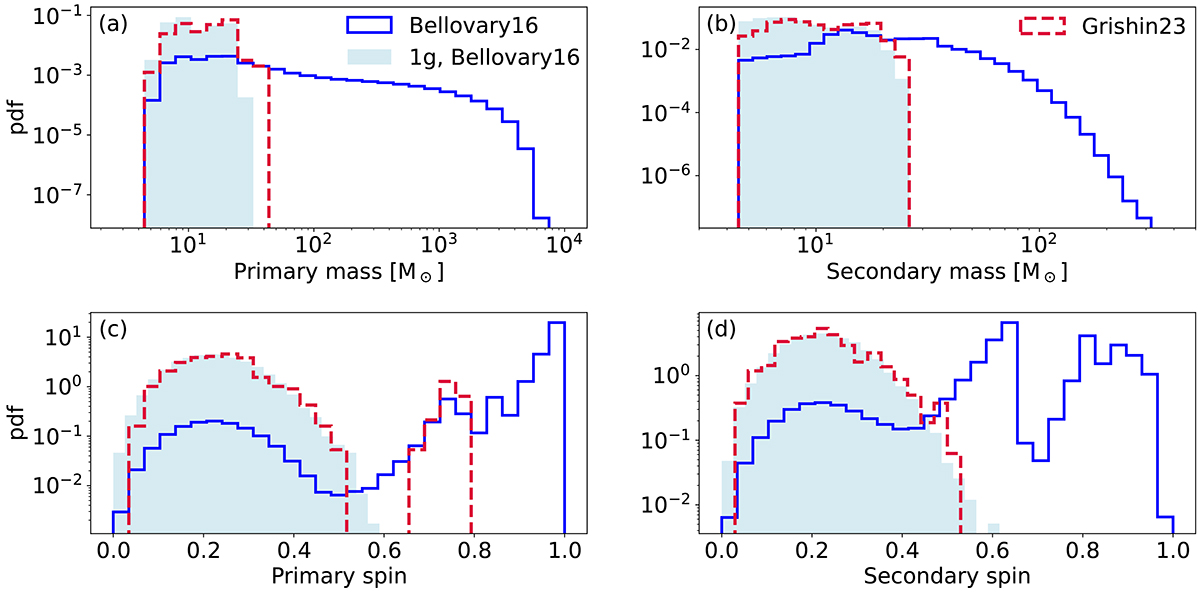
Main properties of dynamical BBH mergers with two different models for the migration timescale and the location of migration traps. The solid blue line shows the fiducial GH model. The dashed red line shows the results of runs where we used the model by Grishin et al. (2024) for both the migration timescale and the location of the migration trap. Filled light blue histograms refer to 1g mergers in the fiducial model. Panels (a) and (b): primary and secondary BH masses. Panels (c) and (d): primary and secondary BH spin magnitudes.
Current usage metrics show cumulative count of Article Views (full-text article views including HTML views, PDF and ePub downloads, according to the available data) and Abstracts Views on Vision4Press platform.
Data correspond to usage on the plateform after 2015. The current usage metrics is available 48-96 hours after online publication and is updated daily on week days.
Initial download of the metrics may take a while.