Fig. 13.
Download original image
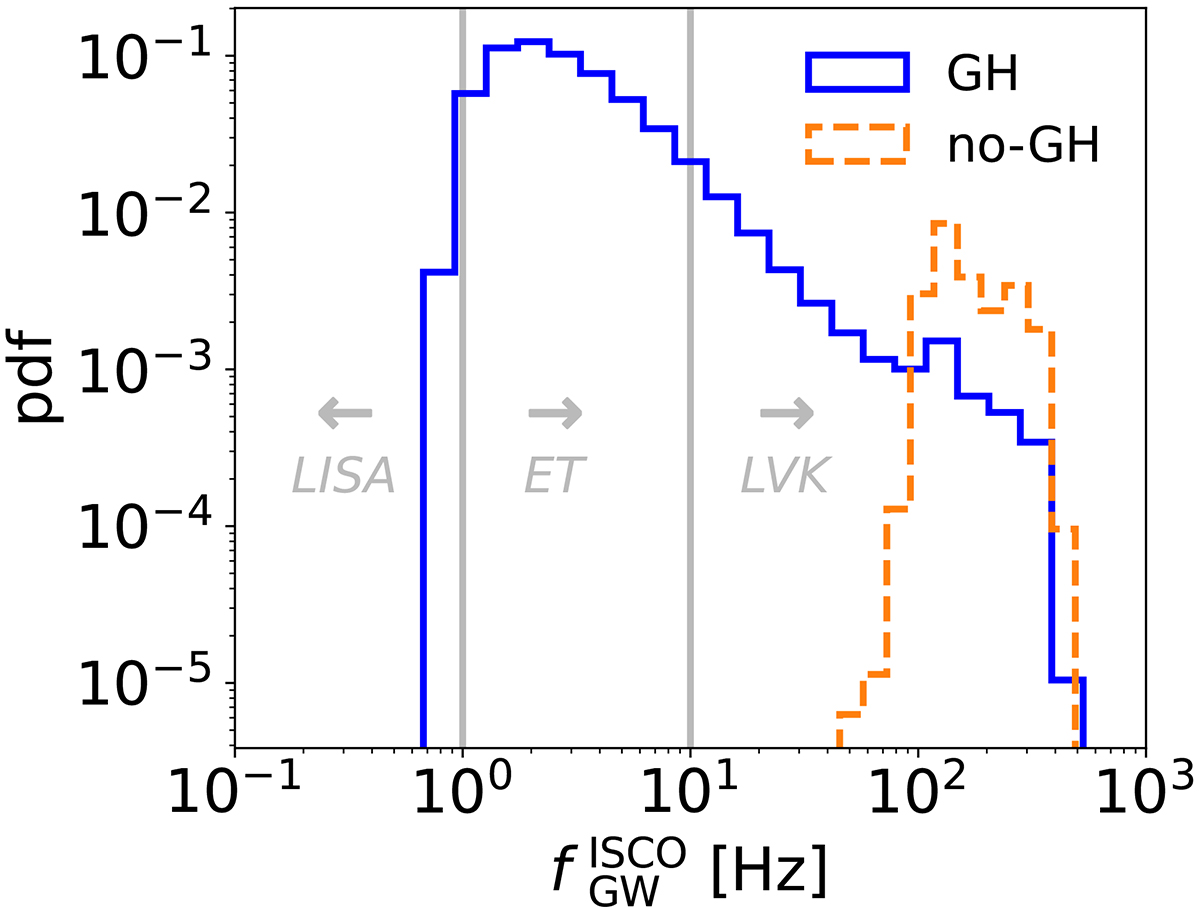
Predictions for the Einstein Telescope (ET) and the Laser Interferometer Space Antenna (LISA). The solid blue (dashed orange) histogram shows the probability density functions (pdf) for ISCO emitted GW frequencies in the GH (no-GH) scenario. The gray lines show the approximate detectable frequencies of LVK detectors, ET, and LISA.
Current usage metrics show cumulative count of Article Views (full-text article views including HTML views, PDF and ePub downloads, according to the available data) and Abstracts Views on Vision4Press platform.
Data correspond to usage on the plateform after 2015. The current usage metrics is available 48-96 hours after online publication and is updated daily on week days.
Initial download of the metrics may take a while.