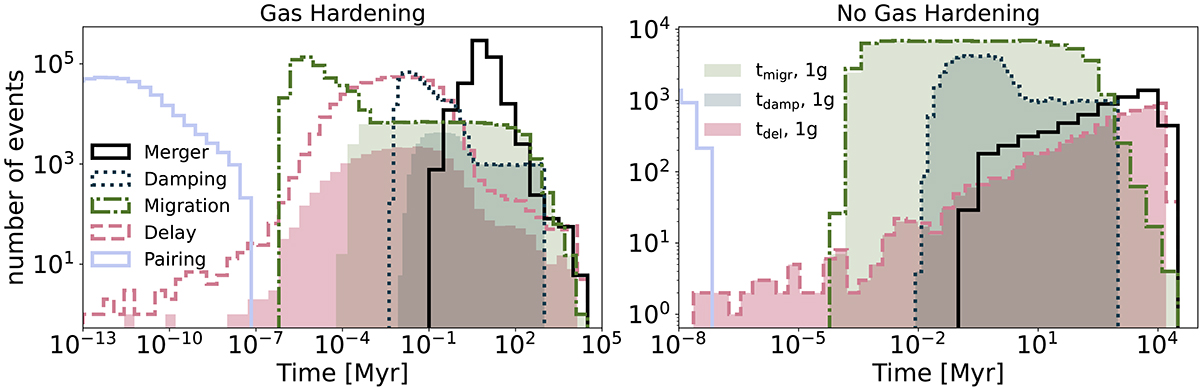
Fig. 12.
Download original image
Relevant timescales in our model. The black line shows the overall merger timescale, tmerg. The dash-dotted green line shows the gas capture timescale, tdamp, (the shaded green histogram shows tdamp for 1g BBHs only). The dotted navy line shoiws the Type I migration timescale, tmigr, I, (the shaded navy histogram shows tmigr, I for 1g BBHs only). The dashed pink line shows the delay timescale, tdel, between the pair-up and the merger (the shaded pink histogram shows tdel for 1g BBHs only). The light blue line shows the gas dynamical friction timescale, τ0, related to BBH pairing (Qian et al. 2024).
Current usage metrics show cumulative count of Article Views (full-text article views including HTML views, PDF and ePub downloads, according to the available data) and Abstracts Views on Vision4Press platform.
Data correspond to usage on the plateform after 2015. The current usage metrics is available 48-96 hours after online publication and is updated daily on week days.
Initial download of the metrics may take a while.