Fig. 1.
Download original image
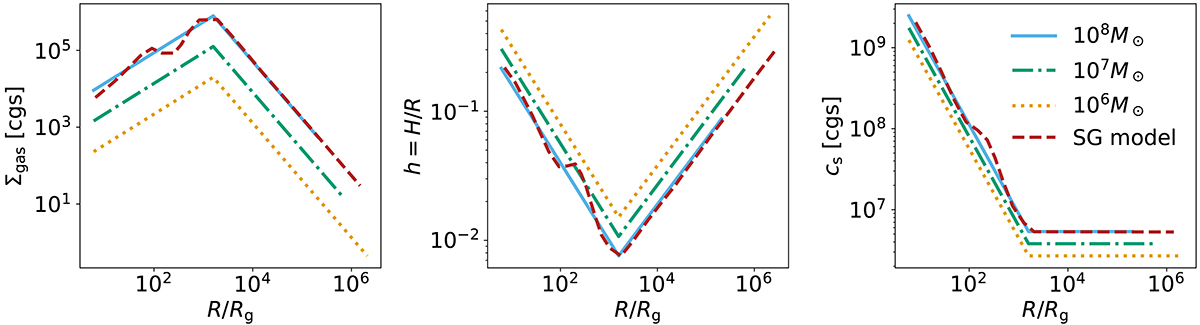
Surface density, Σgas, aspect ratio, h and sound speed, cs, profiles as a function of the scale distance, R/Rg. Dashed maroon lines represent the SG model for a disk with viscosity α = 0.01 around a 108 M⊙ SMBH. Solid blue lines show our broken power-law best fit to the SG model for α = 0.01 and MSMBH = 108 M⊙. The dash-dotted green and dotted orange lines show our fits for a 107 M⊙ and a 106 M⊙ SMBH, respectively (both with α = 0.01).
Current usage metrics show cumulative count of Article Views (full-text article views including HTML views, PDF and ePub downloads, according to the available data) and Abstracts Views on Vision4Press platform.
Data correspond to usage on the plateform after 2015. The current usage metrics is available 48-96 hours after online publication and is updated daily on week days.
Initial download of the metrics may take a while.