Fig. B.3
Download original image
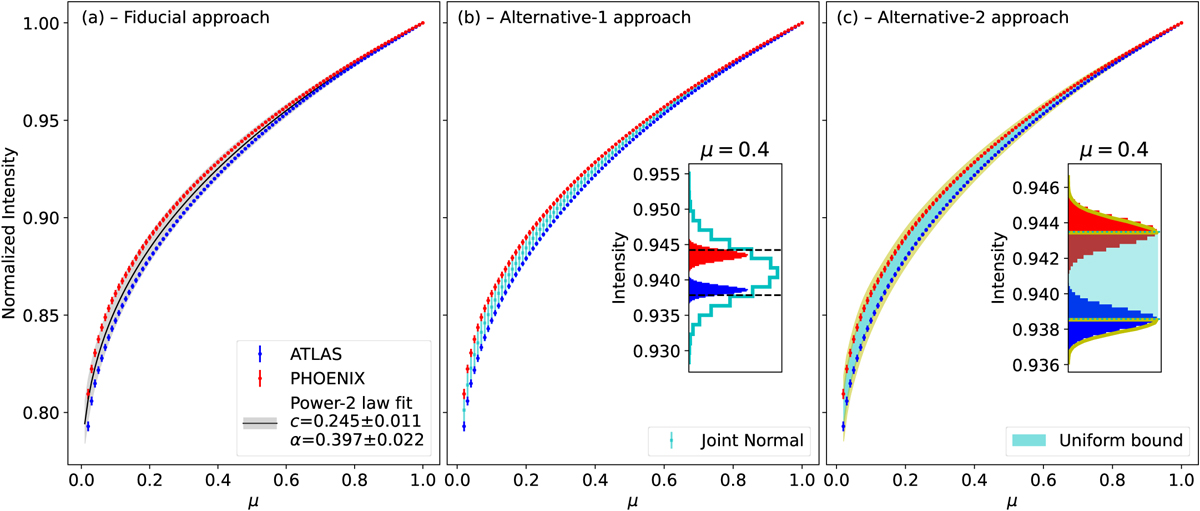
Different approaches adopted to model the stellar limb darkening using model stellar intensity profiles from the PHOENIX (red) and ATLAS (blue) libraries. The plots illustrate the approaches for the Spitzer 4.5µm passband observations. Panel (a) illustrates our “fiducial” approach where LDCs are generated to be used as priors in the transit model fitting. The black curve shows the fit of the power-2 law to the combined model intensity profiles. The parameter space (gray) allowed by the 1σ uncertainty of the obtained LDCs encompasses both intensity profiles and associated 1σ uncertainties. Panel (b) shows the “alternative-1” approach which merges the PHOENIX and ATLAS model profiles to create a new joint intensity profile (cyan) whose 1σ uncertainties at each µ encompasses the 1σ uncertainty of the individual profiles. This is illustrated in the inset for µ = 0.4. The new joint profile is fitted with an LD law alongside the transit observation at each passband. Panel (c) shows the “alternative-2” approach which similarly combines both intensity profiles but creates a uniform bound (cyan) spanning the median of both profiles such that LD profile points within the bound have equal likelihood but decrease as the profile points deviate from the bound.
Current usage metrics show cumulative count of Article Views (full-text article views including HTML views, PDF and ePub downloads, according to the available data) and Abstracts Views on Vision4Press platform.
Data correspond to usage on the plateform after 2015. The current usage metrics is available 48-96 hours after online publication and is updated daily on week days.
Initial download of the metrics may take a while.