Fig. B.1
Download original image
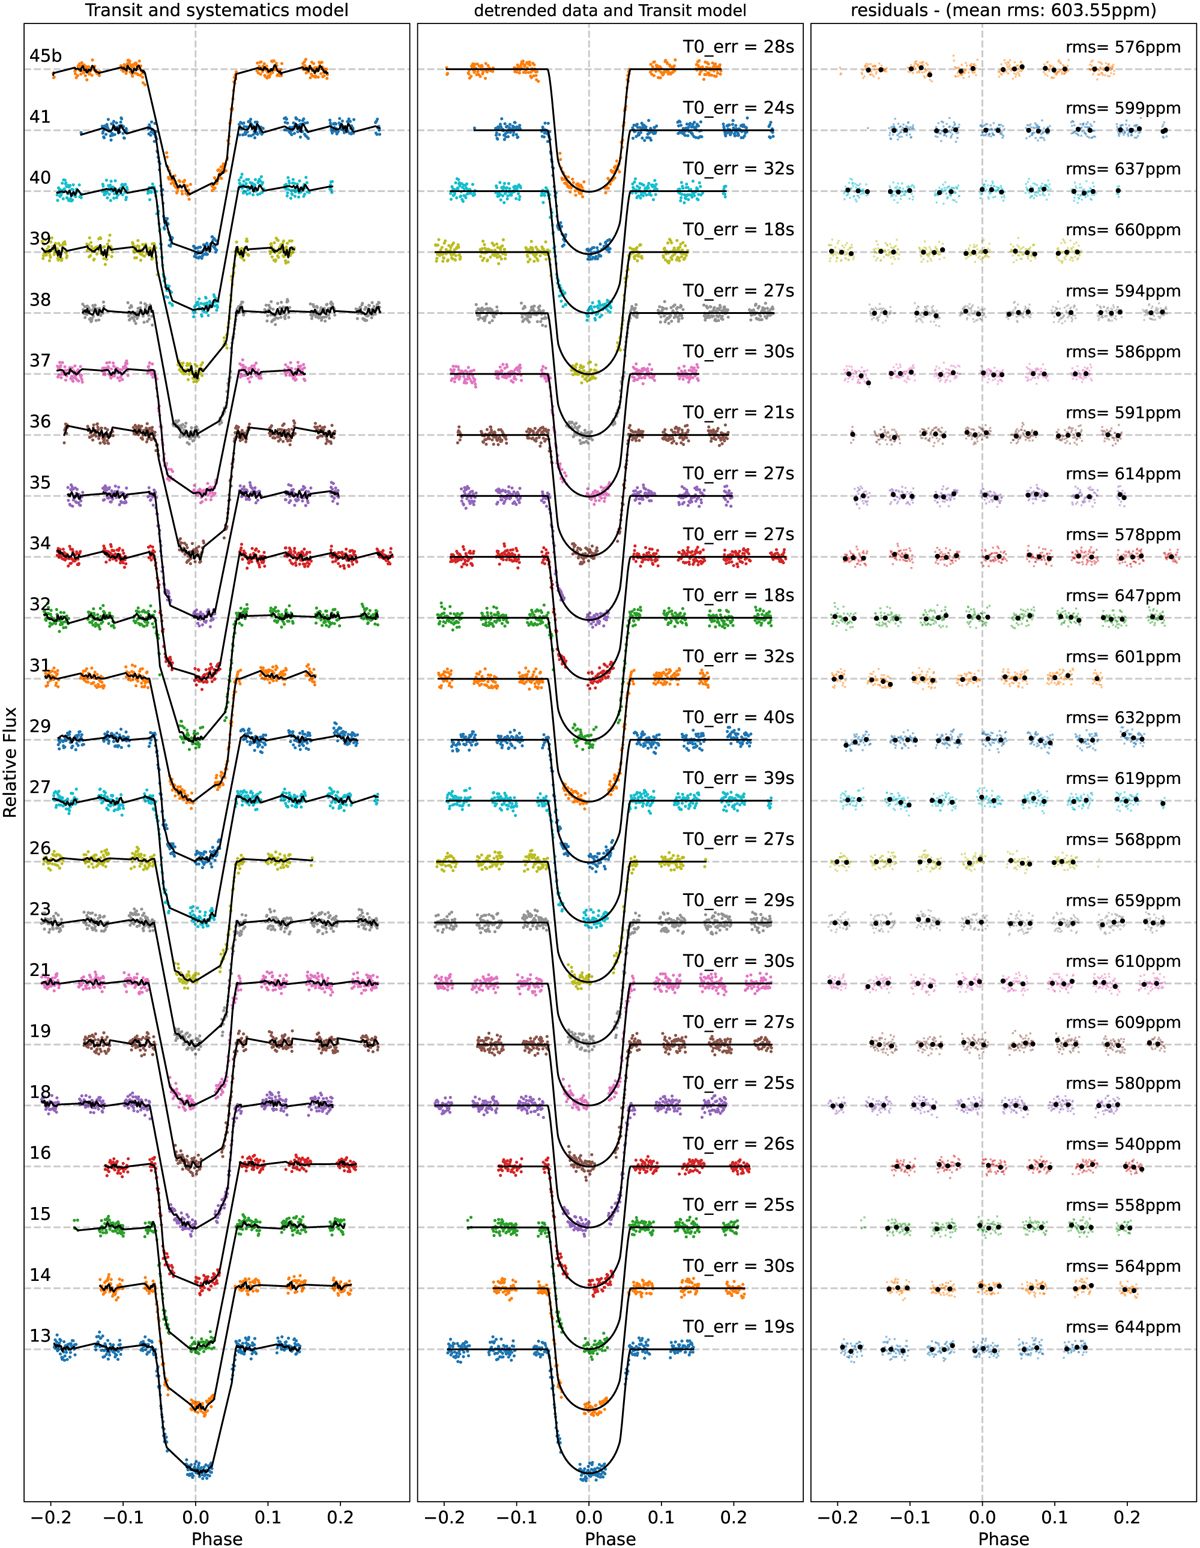
CHEOPS transit light curves of WASP-12b labeled according to the visit number. Left: The best-fit transit and systematics model is overplotted on the data. Middle: Systematics detrended flux with transit model overplotted. The obtained transit time uncertainty for each visit is shown in seconds. Right: Residuals after subtraction of best-fit transit and systematics model. The 30-min bins and the root-mean-square (rms) of each visit are also shown.
Current usage metrics show cumulative count of Article Views (full-text article views including HTML views, PDF and ePub downloads, according to the available data) and Abstracts Views on Vision4Press platform.
Data correspond to usage on the plateform after 2015. The current usage metrics is available 48-96 hours after online publication and is updated daily on week days.
Initial download of the metrics may take a while.