Fig. B.5
Download original image
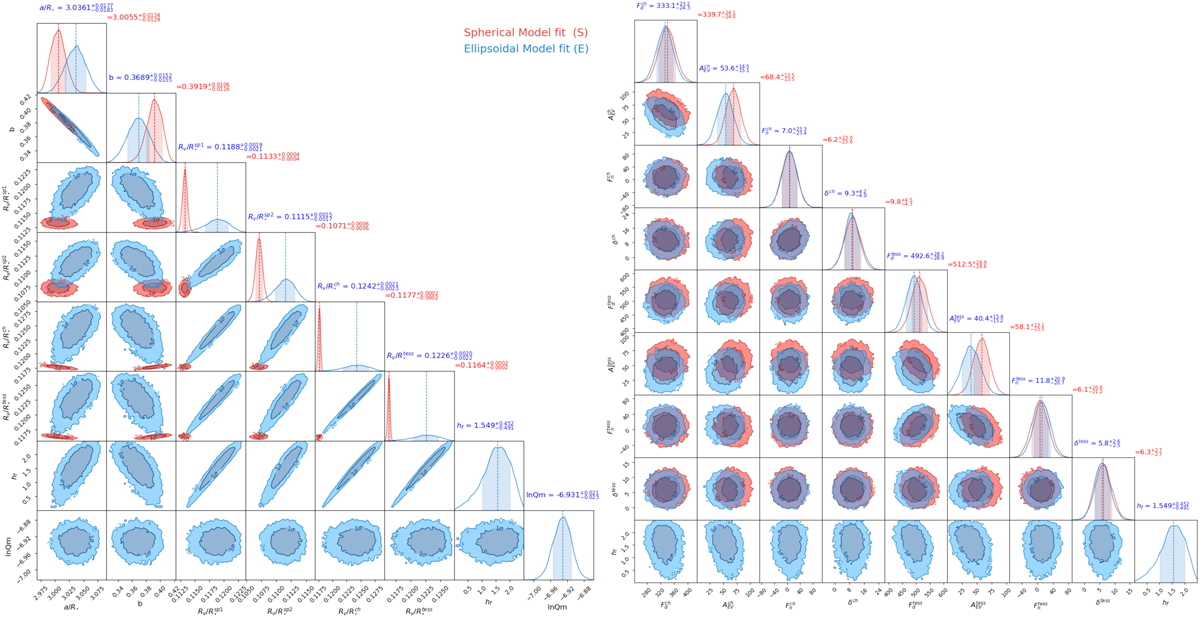
Corner plot showing the posterior probability distributions of the fitted parameters for the spherical planet model (red) and ellipsoidal planet model. Vertical colored lines indicate the median of the distributions while shaded regions define the 68%credible intervals. The different instruments are labeled: CHEOPS (ch), TESS (tess), Spitzer 3.6µm (spl), and Spitzer 4.5µm (sp2).
Current usage metrics show cumulative count of Article Views (full-text article views including HTML views, PDF and ePub downloads, according to the available data) and Abstracts Views on Vision4Press platform.
Data correspond to usage on the plateform after 2015. The current usage metrics is available 48-96 hours after online publication and is updated daily on week days.
Initial download of the metrics may take a while.