Fig. 1
Download original image
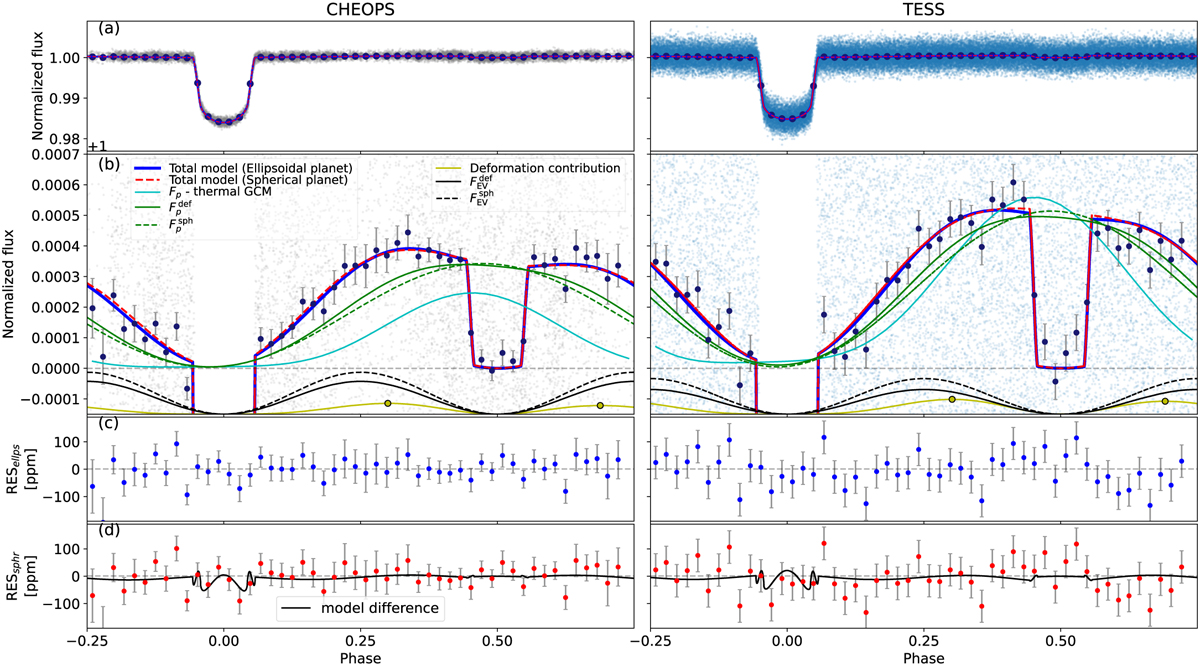
CHEOPS (left) and TESS (right) phase curves of WASP-I2b. Panels a: the total phase curve models overplotted on the detrended and phase-folded data. Panels b: zoom of panel a showing the different components of the total phase curve. The solid blue curve is the total phase curve model for an ellipsoidal planet, while the red dashed curve is for a spherical planet. The solid and dashed green curves represent the best-fit planetary phase variation component (Fp) for the deformed and spherical planets, respectively. The cyan curve is the computed thermal-only 3D GCM for the planet (see Sect. 5.2.2) which shows for CHEOPS that some reflection from the atmosphere is required to reach the amplitude of the green curves. The black curves at the bottom of this panel show the best-fit stellar ellipsoidal variation (FEV) from the deformed (solid) and spherical (dashed) planet model fits. The yellow curve represents the contribution of tidal deformation to the total phase curve, with circles denoting the peaks. Panels c and d: the residuals of the phase curve fits using the ellipsoidal (blue) and spherical (red) planet models. The difference between the models (ellipsoidal–spherical) representing the deformation signature in each passband is overplotted on the spherical model residuals.
Current usage metrics show cumulative count of Article Views (full-text article views including HTML views, PDF and ePub downloads, according to the available data) and Abstracts Views on Vision4Press platform.
Data correspond to usage on the plateform after 2015. The current usage metrics is available 48-96 hours after online publication and is updated daily on week days.
Initial download of the metrics may take a while.