Fig. 9
Download original image
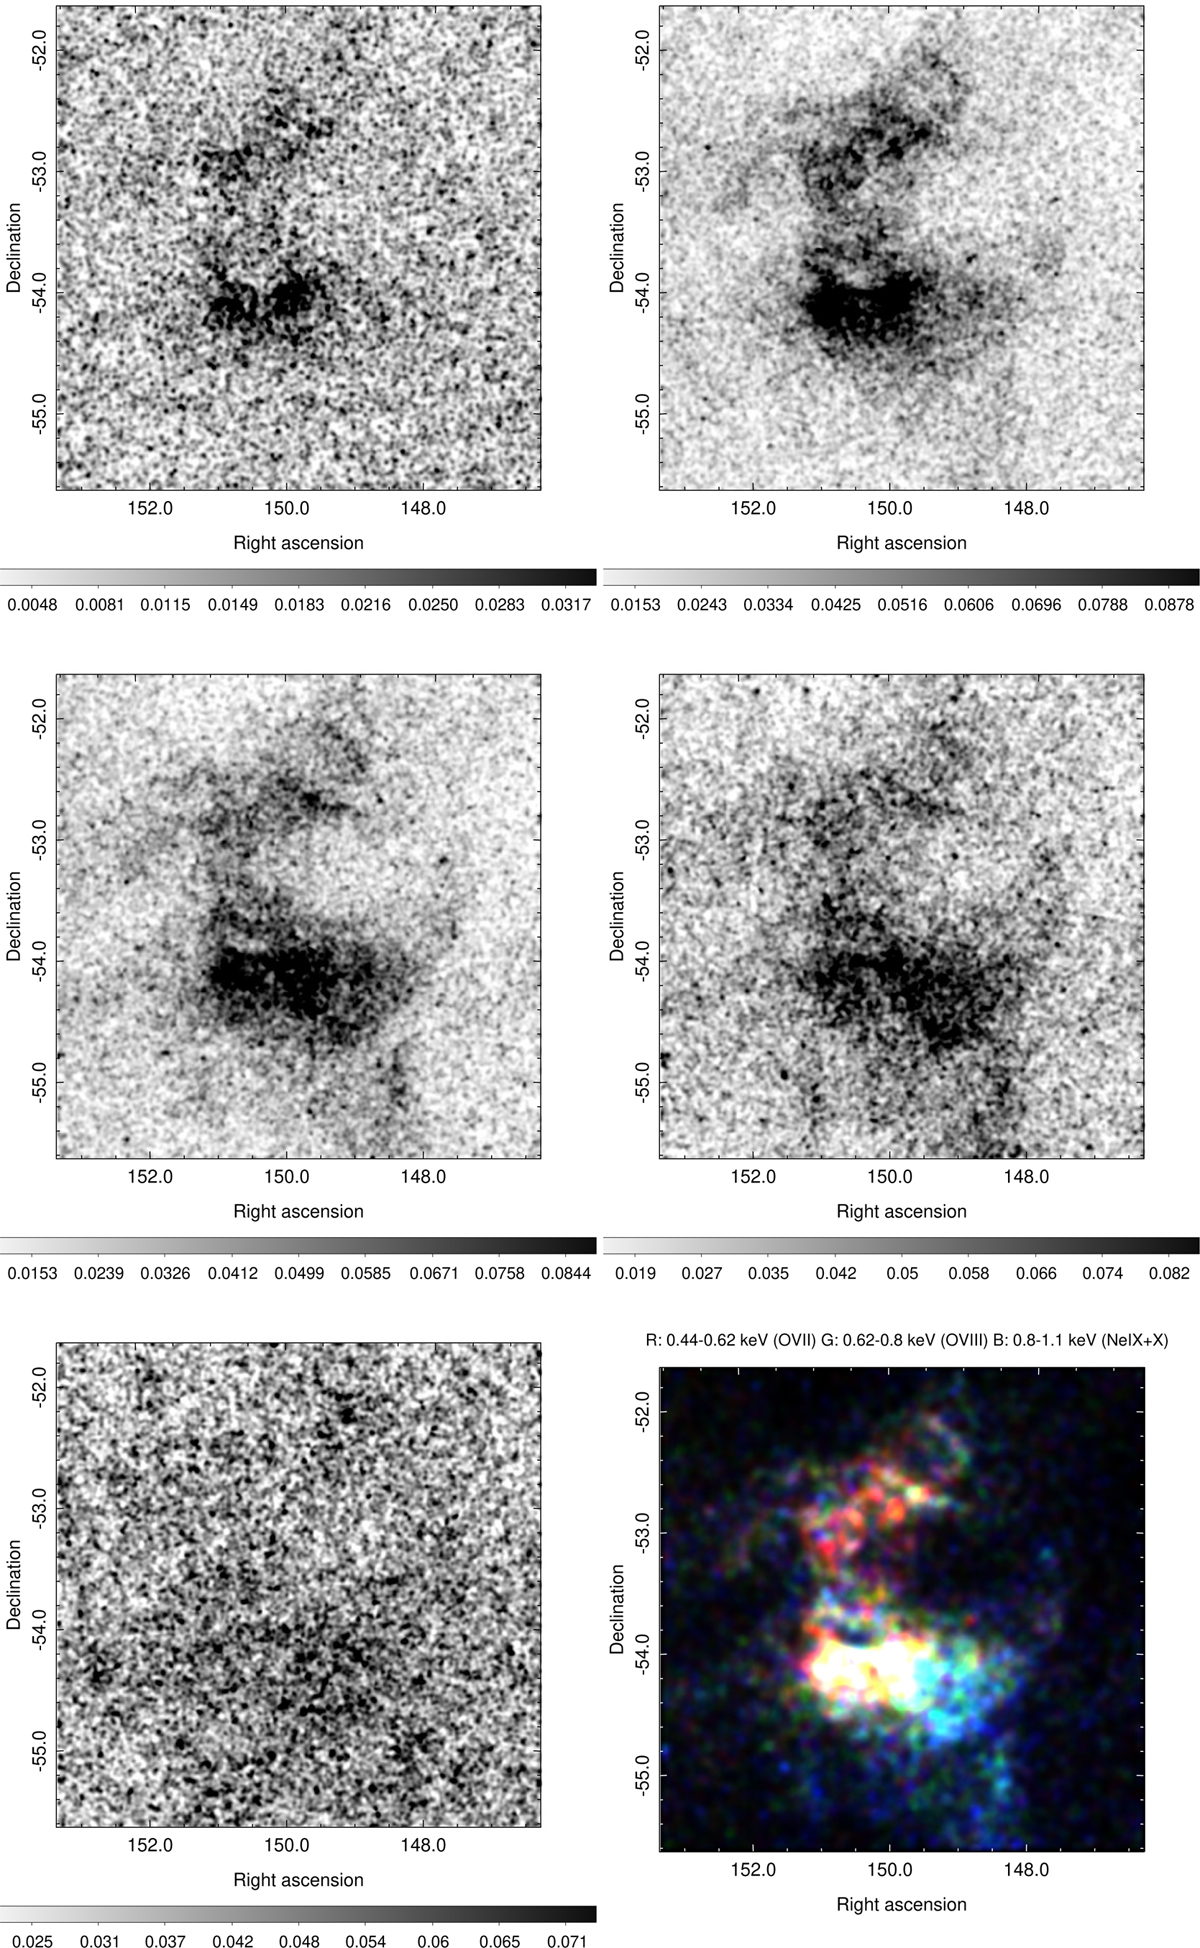
eRASS:4 exposure-corrected intensity sky maps in units of counts per pixel. The five distinct panels depict narrow, spectrally motivated energy bands: 0.3–0.44 keV (N, upper left), 0.44–0.62 keV (OVII, upper right), 0.62–0.80 keV (OVIII, middle left), 0.80–1.10 keV (NeIX+X, middle right), and 1.10–2.10 keV (Mg, lower left). The sixth one (RGB, lower right) displays the distribution of the different elemental abundances detected across the remnant.
Current usage metrics show cumulative count of Article Views (full-text article views including HTML views, PDF and ePub downloads, according to the available data) and Abstracts Views on Vision4Press platform.
Data correspond to usage on the plateform after 2015. The current usage metrics is available 48-96 hours after online publication and is updated daily on week days.
Initial download of the metrics may take a while.