Fig. 8
Download original image
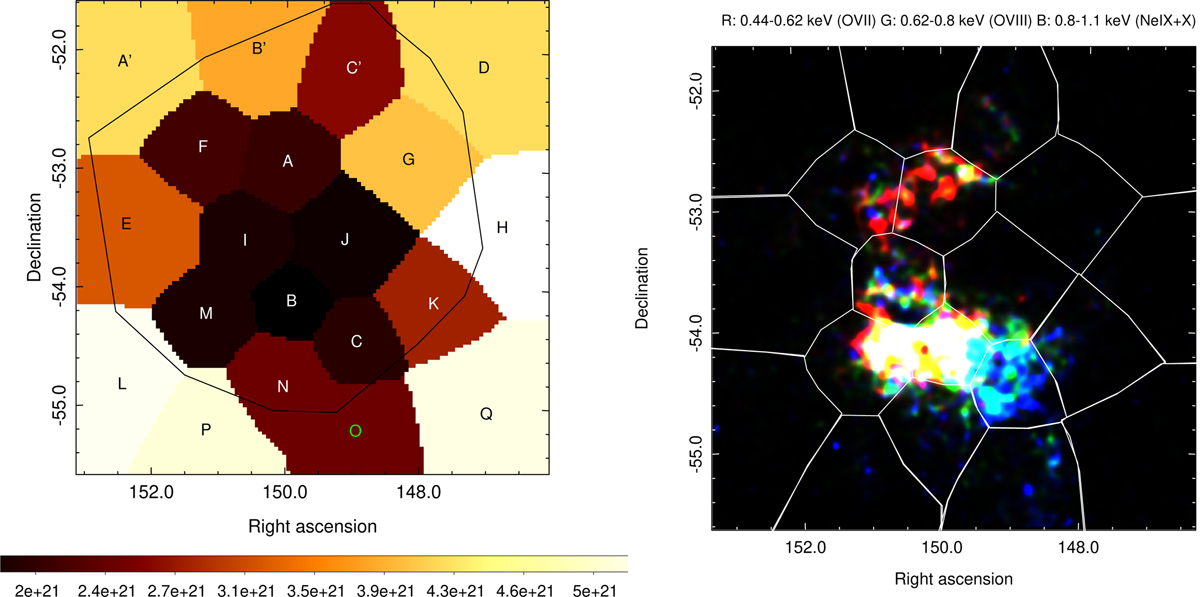
Absorption features and elemental abundance distribution across the remnant’s area. Left panel: absorption column density map (in units of cm−2) from the location of the remnant, as computed by the best-fit absorption column density. Values are obtained from each distinct subregion defined by the Voronoi binning algorithm. The region selected for spectral analysis of the entire remnant is shown as a black line. Regions of significant diffuse X-ray emission from the remnant are displayed in white letters whereas those surrounding regions containing faint diffuse X-ray emission from the remnant are displayed in black letters. Finally, in green the region which contains diffuse X-ray emission unrelated to the remnant is shown. Right panel: eRASS:4 RGB image (R: 0.44–0.62 keV (O VII), G: 0.62–0.80 keV (O VIII), B: 0.80–1.10 keV (Ne IX+X)), identical to the lower right panel of Fig. 9 but in power scale aiming to reveal the strongest elemental abundance at each subregion where we perform spectral analysis. It displays the distribution of the different elemental abundances detected across the remnant. White contours represent the 20 distinct regions obtained from the Voronoi binning analysis to be used for further spectral analysis.
Current usage metrics show cumulative count of Article Views (full-text article views including HTML views, PDF and ePub downloads, according to the available data) and Abstracts Views on Vision4Press platform.
Data correspond to usage on the plateform after 2015. The current usage metrics is available 48-96 hours after online publication and is updated daily on week days.
Initial download of the metrics may take a while.