Fig. 7
Download original image
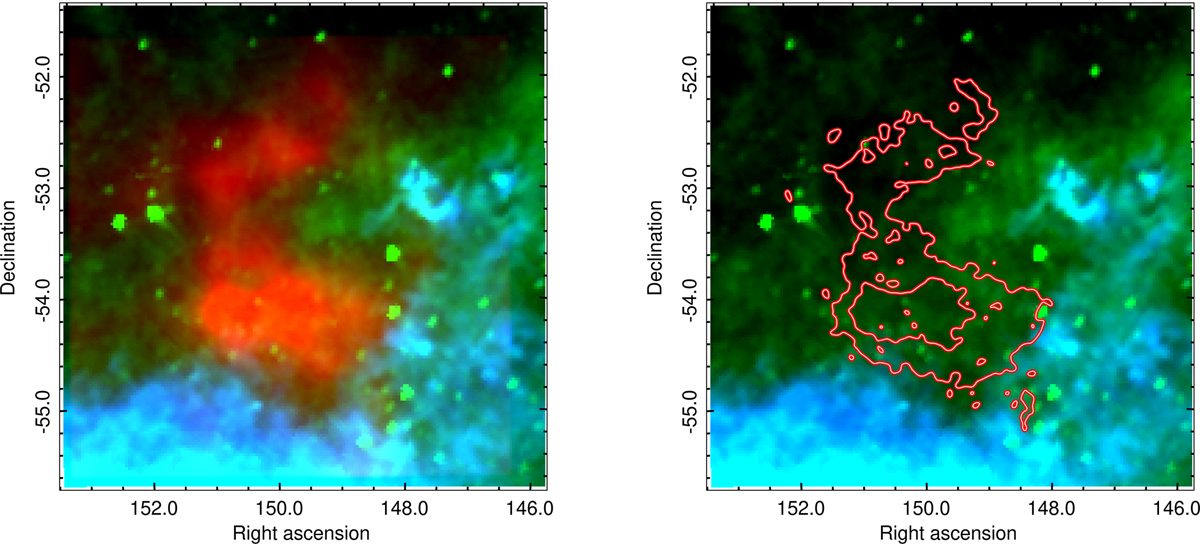
Spatial correlation between X-ray and IR data from the remnant’s location. Left panel: RGB image, displaying combined eRASS:4 X-ray data in the 0.3–1.1 keV energy band (red), IRAS 25 µm data (green), and IRAS 100 µm data (blue) from the location of the remnant. Right panel: Combined IRAS 25 µm data (green) and IRAS 100 µm data (blue) from the location of the remnant. The red contours represent two levels of eRASS:4 X-ray data in the 0.3–1.1 keV energy band which we overlaid to IRAS data sets, aiming at inspecting the IR emission at the location of the X-ray excess, as observed with eROSITA, and enhancing the apparent anti-correlation in the two distinct energy bands, that is to say how the IR emission “respects” the X-ray excess emanating from the remnant in the south and west.
Current usage metrics show cumulative count of Article Views (full-text article views including HTML views, PDF and ePub downloads, according to the available data) and Abstracts Views on Vision4Press platform.
Data correspond to usage on the plateform after 2015. The current usage metrics is available 48-96 hours after online publication and is updated daily on week days.
Initial download of the metrics may take a while.