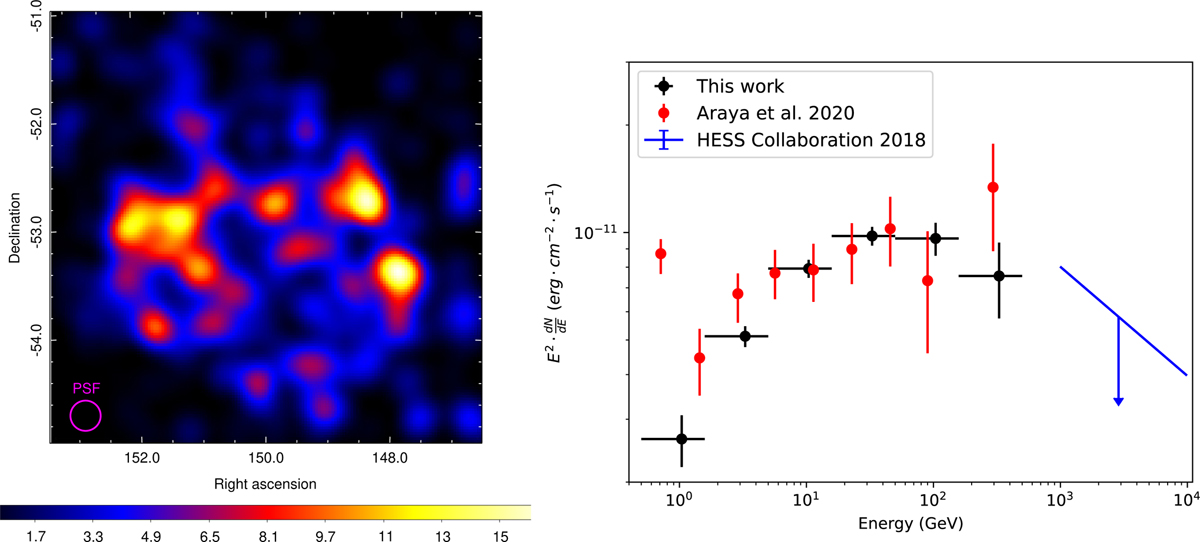
Fig. 6
Download original image
γ-ray imaging and spectral analysis results of G279.0+01.1. Left panel: 4° × 4° Fermi-LAT TS map >5 GeV centered at the coordinates used in Araya (2020). The image, of 90" pixel size, is convolved with a σ = 6.75′ Gaussian. The magenta thick circle represents the 68% containment PSF size, applied at the 5 GeV energy threshold used for the construction of the TS map. Right panel: 4FGL J1000.0-53l2e Fermi-LAT SED. Black dots correspond to the Fermi-LAT spectrum in the 0.5–500 GeV band, obtained in this work. Red and blue dots correspond to giga-electronvolt Fermi-LAT data reported in Araya (2020) and TeV-H.E.S.S. upper limits reported in H.E.S.S. Collaboration (2018b), respectively.
Current usage metrics show cumulative count of Article Views (full-text article views including HTML views, PDF and ePub downloads, according to the available data) and Abstracts Views on Vision4Press platform.
Data correspond to usage on the plateform after 2015. The current usage metrics is available 48-96 hours after online publication and is updated daily on week days.
Initial download of the metrics may take a while.