Fig. 5
Download original image
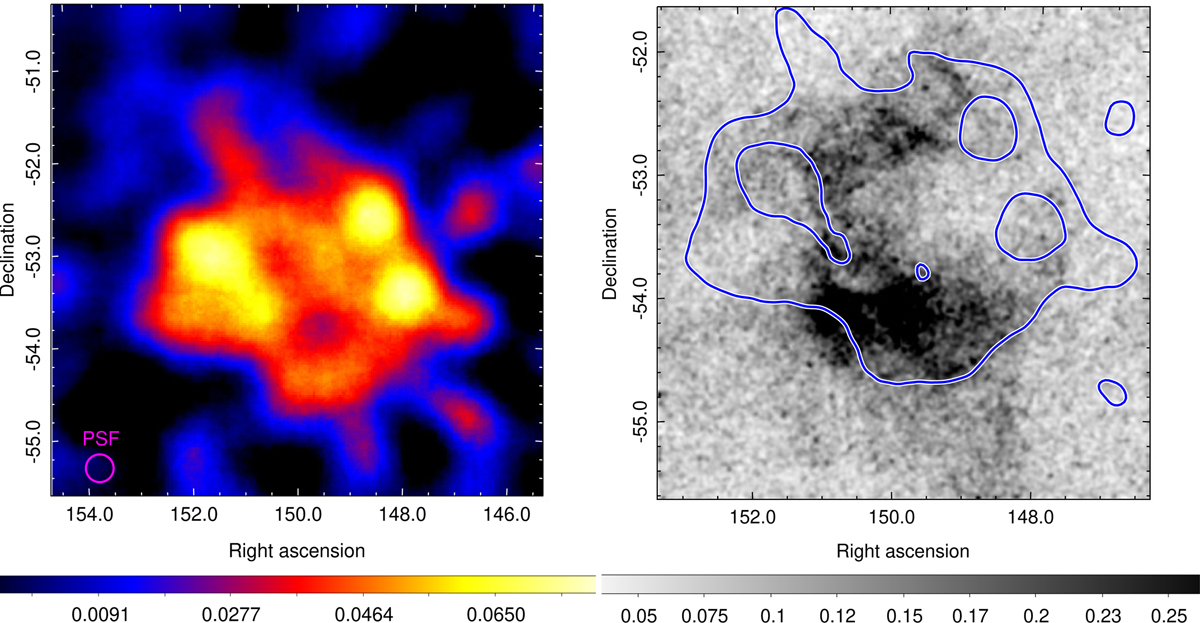
Spatial correlation between X-ray and γ-ray emission from the remnant. Left panel: 5.3° × 5.3° Fermi-LAT residual count map > 5 GeV centered at the coordinates used in Araya (2020), in units of counts per pixel. The image, of 90″ pixel size, is convolved with a σ = 15′ Gaussian. The magenta thick circle represents the 68% containment PSF size at 5 GeV energy threshold used for the construction of the residual count map. Right panel: eRASS:4 exposure-corrected intensity sky map, with the same parameters as the one displayed in Fig. 1. The blue contours mark the giga-electronvolt extension of 4FGL J1000.0-53l2e as displayed on the Fermi-LAT residual count map on the left panel of the figure.
Current usage metrics show cumulative count of Article Views (full-text article views including HTML views, PDF and ePub downloads, according to the available data) and Abstracts Views on Vision4Press platform.
Data correspond to usage on the plateform after 2015. The current usage metrics is available 48-96 hours after online publication and is updated daily on week days.
Initial download of the metrics may take a while.